ROOT Version: 6.18/00
Platform: Red Hat 8.5.0-16
Compiler: gcc version 8.5.0
Hello experts,
I have a question regarding the TEfficiency plots. I am creating the plots as
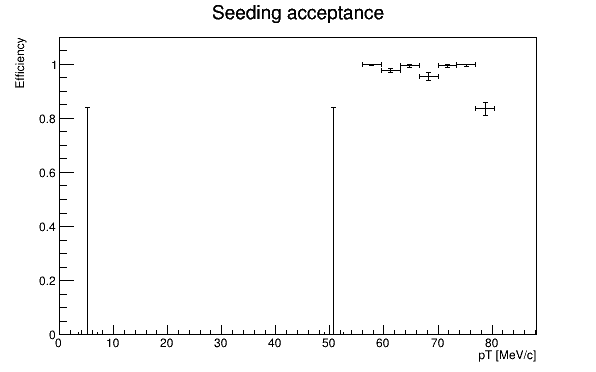
TEfficiency* pEff = new TEfficiency("eff","Seeding acceptance; pT [MeV/c]; Efficiency",30,0,105);
for (range) {
     if (A) {pEff->Fill(true, value);}
     if (B) {pEff->Fill(false, value);}
}
and I get this attached plot. Why am I getting the first two huge error bars? What do they stand for?
Thank you in advance!