I was wondering if there are any plans to introduce a “symmetric log scale” (symlog) in the future, as one of the axis display options for plots?
I’ve seen the topic appear in some previous talks (2015, 2017) but as far as I can tell, this feature is not yet implemented. I’ve found that there are quite a few circumstances where it can be handy to have such an axis for a plot, e.g. one is looking at the distribution of some variable that covers many orders of magnitude and which can be either positive or negative.
My present workaround (which I’ve seen others use) is to display such histograms with the Python matplotlib package, which implements this feature, but it would be great to be able to use ROOT’s own plotting abilities.
Such plot with ROOT 6 would require 2 log axis (along X) I guess. We can try to make some macro to implement it and see if that can be easily generalized. Do you have some data (for instance a TGraph) you would like to plot with a such scale along X ?
We could also have a dedicated axis kind for this, I suppose? Maybe internally, on the JS side, this could then be implemented the way you describe, but the user interface could be different?
Yes in the context of JSROOT that can be a new kind of axis. For ROOT 6 I was thinking to first make a prototype with the existing TGaxis. That might work. But that will imply also transformation on the data themselves as some of them along X (for instance) will be negative. The macro prototype should take that in to account also (axis and data transformation).
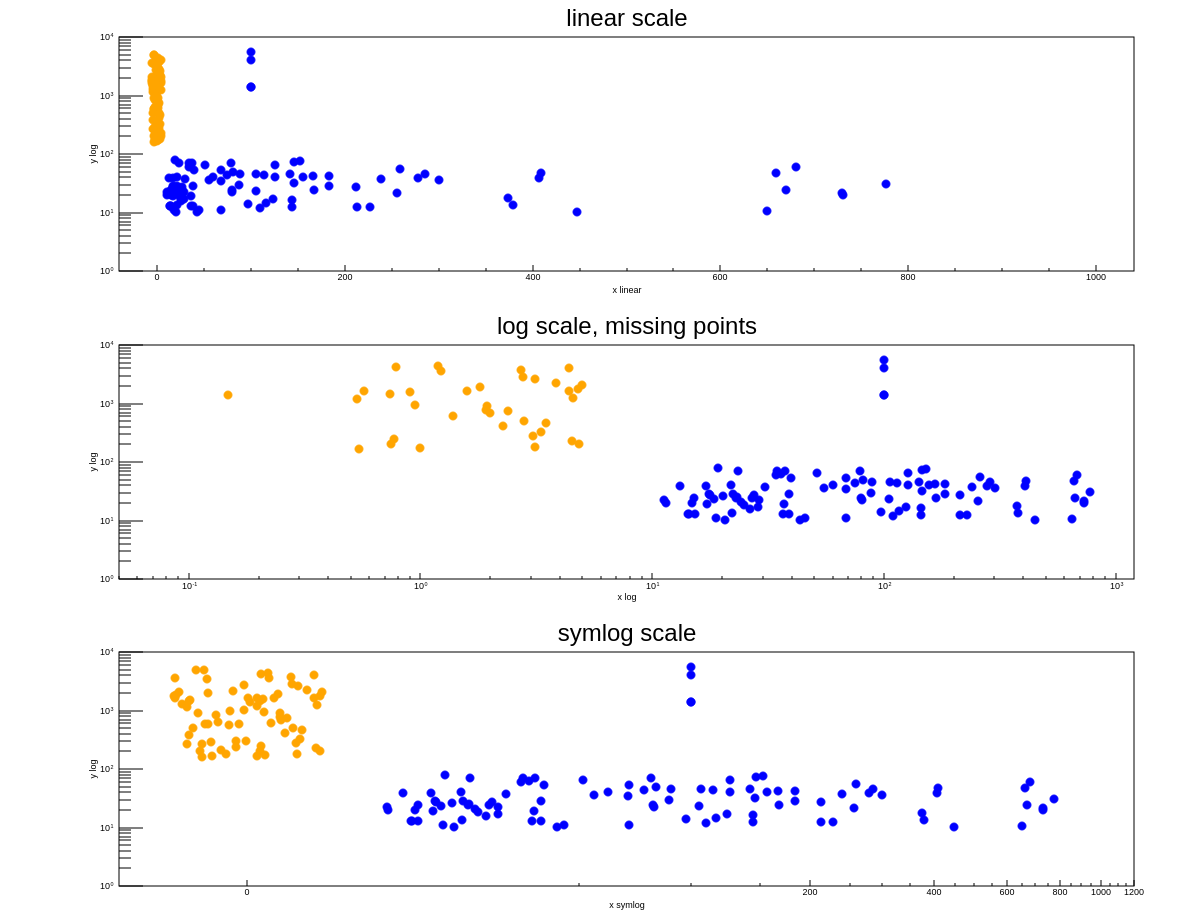
Here is first try with v7 RFrame/RAxis. Same data drawn with linear, log and symlog X scale. While there are negative values, log scale missing some data. Only ticks selection is sub-optimal, but this is general problem of d3.js implementation. I will create PR soon.
For curiosity I add symlog support also for ROOT6 classes, but it only will work on the JSROOT side. example1, example2