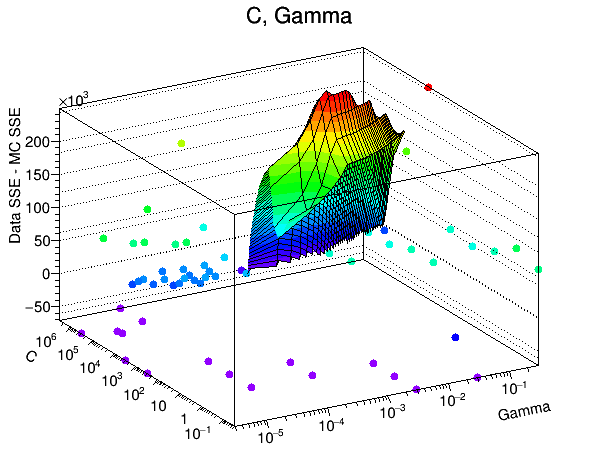
I am trying to plot a colored surface in a 2DGraph. The surface is however not drawn for the full region of the data point. The picture below shows the data points and the surface, which gets drawn only in a small region of the plot. I tried several combinations as can be seen in the attache .cc file from the commented lines. The values to be plot are also attached. I’m using root-6.04.00.
A further strange thing is that the axis labels disappear as soon as I rotated the graph or use “sseDiffCanv -> Update();”
I would very much appreciate help, especially for the first problem.
outputComparison_values.txt (2.54 KB)
plot_SVN-MC.cc (2.42 KB)