Hello,
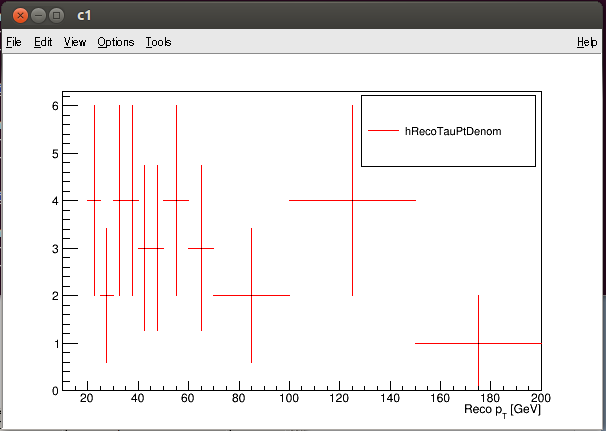
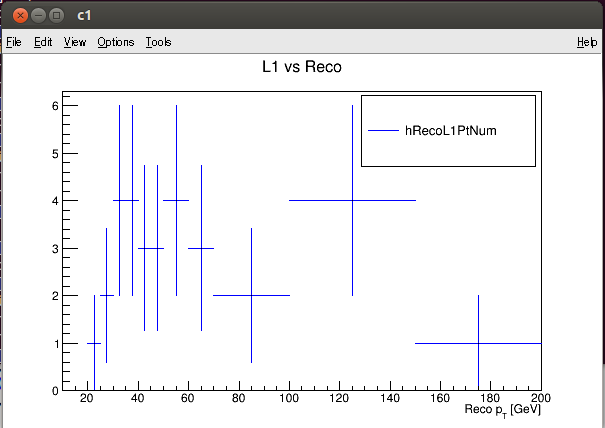
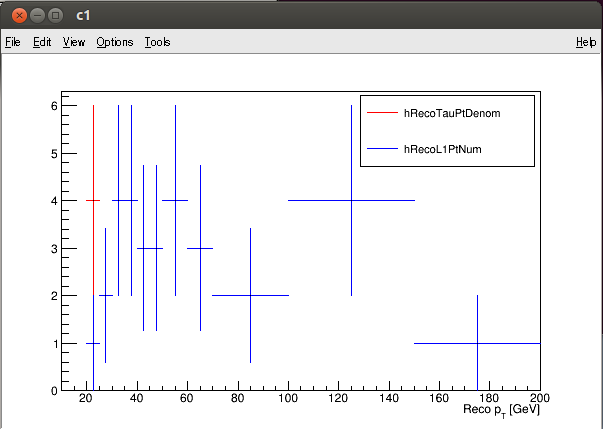
i have two histograms which i want to plot on the same canvas with the “same” option and i am getting a weird output. Only part of the first histogram is plotted (red one) while all points of the second one (blue) are plotted.
You can see in the attachment the first one (h1), the second one (h2) and the how are they superimposed.
This is the code i use:
TFile *f=new TFile(“myrootfile.root”);
TH1F h1=(TH1F)f->Get("h1name);
TH1F h2=(TH1F)f->Get(“h2name”);
TCanvas *c = new TCanvas(“c”,“c”,600,400);
gStyle->SetOptStat(“nemruoi”);
h1->SetLineColor(kRed);
h1->Draw();
h2->SetLineColor(kBlue);
h2->Draw(“SAME”);
gStyle->SetOptStat(0);
leg = new TLegend(0.6,0.7,0.89,0.89);
leg->AddEntry(h1,h1->GetName(),“l”);
leg->AddEntry(h2,h2->GetName(),“l”);
leg->Draw();
c->Draw();
Why are not the all points of the first histogram (red one) shown on the superimposed canvas?
Thank you very much.