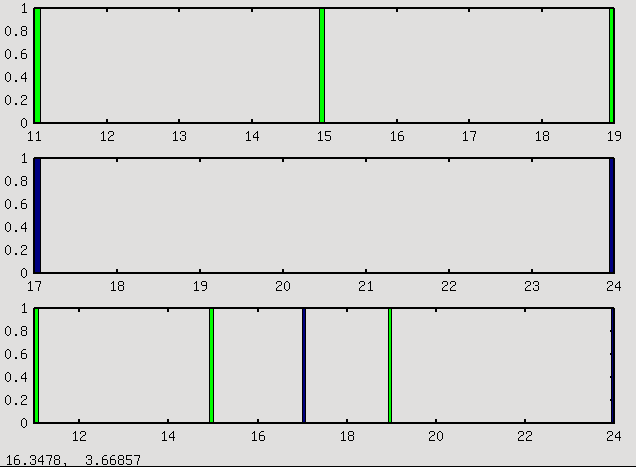
why the scale on the third is the one scale? I think that the right scale would be [ min ( (min bin one), (min bin two) ) , max (max bin one, max bin two) ), so in the third graph I can see three green bins and two bins white.
For example, in octave (a free clone of MatLab):
subplot(3,1,1)
hist(a,100,'g')
subplot(3,1,2)
hist(b,100)
subplot(3,1,3)
hist(a,100,'g')
hold
hist(b,100)
[quote=“brun”]What you obtain is what you requested.
The pad scale is set by the first histogram drawn in the pad. Drawing another histogram with option “same” does not change the scale (hopefully!)
Whe using the THStach, you should draw it with option “nostack”
see documentation and tutorials about THStack.
Rene[/quote]
I think it’s unnececessarily complicated. How many code lines I need to write to superimposed two histogram if I want to see all the histogram, the first and the second? and not the first and the piece of the second that is superimposed to the first.
[quote=“brun”]Ouih!!! this seems to be a complicated question. I am sorry, but I have no solution until you ask a clear question
Rene[/quote]
I don’t think it’s a complicated job. I have 2 TTree. One for the signal, one for the background. I want to plot several variables with differts TCut. And I want to draw the two histogram. For example:
void display(TCanvas c1, TCut cut, vector<string> variables, TTree signal, TTree, bk)
// in the vector variable there are all the varibles that I want to analyse
{
   c1.Divide(......)
   ...
   int i =0;
   foreach variable in variables
   {
    ++i;
    c1.cd(i)
    signal.Draw(variable,"cut")
    bk.Draw(variable,"cut","same")
   }
}
but the two histogram have not the same scale. I want to draw a plot with signal and bk superimposed, but I want to see all the signal, and all the background. With this code I’m seeing all the signal, but only a bit of bk.