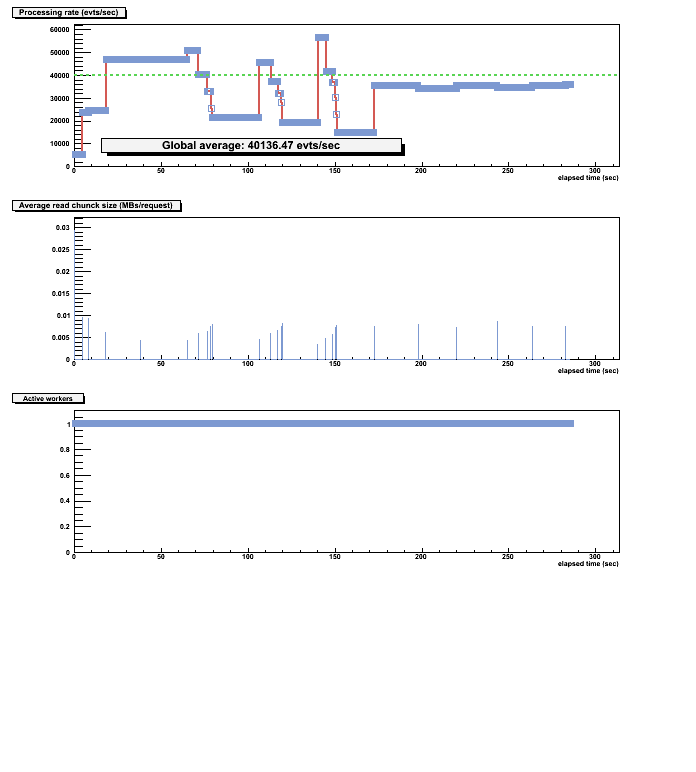
While studying the performance of the proof farm I detected a weird behaviour of the processing event rate when using just 1 proof worker. I would expect to get more or less the same pattern using 1 proof worker compared to what I get running the same job as a local job (without the proof machinery) on exactly the same machine.
In the plot you can see the proc evt rate of the analysis, with those wholes that last around 20 seconds. During that time the CPU of the worker is idle and seems to be waiting to receive a new packet to process?
I get the same behaviour reading data from nfs and dCache servers.
The point is that if I run the same job on the same machine locally, I get a uniform evt proc rate at the highest value reached by the proof job.
I have the feeling that something may be wrong with the Packetizer (using the default) as the worker is just waiting for new packets to process, but I dont know how to follow this or get more debugging information. I would be grateful if someone could give me a hint.
Im using 5.26b and the job is configure to use the TreeCache with a TreeCacheSize = 30MB and
PROOF_UseParallelUnzip = 1
Could you please quantify what is the overall performance difference between the local job and PROOF with 1 workers?
Because of the PROOF overhead, you would expect between 5-10% worse results in PROOF.
Note also that the peaked structure in the performance histogram reflects the fact that correct reports about the performance can only be given after receiving the timings about the last fully processed packet. So the structure is somewhat artificial, especially when you have a small number of workers.
Also, how can you say that the worker is idle waiting for a packet and not waiting for IO? If you create the performance tree following root.cern.ch/drupal/content/crea … mance-tree and you put the file in some public place we can have a closer look at what is going on.
I also suggest not to use by default PROOF_UseParallelUnzip = 1 because this feature is highly experimental and it is not yet clear is which cases this really helps.
I was also expecting an overhead from PROOF, but the results I get are worse than 10%. In overall, the job could be 10 times slower when sending to proof with 1 worker compared to a local job.
I also suspected that the plots I was getting from the monitoring could be misleading so within the job I integrated some lines of code to measure the event rate of the job, and I could confirm the same peak structure in the event rate. Quite often I observe drops in the event processing rate, similar to the plot I attached.
What makes me think that these gaps of time (of very low event rate) were not due to I/O wait is first, that I dont observe the same peak structure running out of proof. There, the event processing rate is quite uniform, and both jobs are requesting the same data to the same disk server. And second, while monitoring the proof worker and the disk server, I didnt observe an increasing cpu I/O wait (for the worker) nor saturation (of the server).
I put the performance tree under my afs public area:
/afs/cern.ch/user/c/cosuna/public/Proof/proofperf.root
I also would be very grateful if you could point me to a description of the content of the performance tree for a further understanding of what is going on, for I couldnt find one (apart from the histograms generated).
Your job is reading 1.18 GB of data at an average rate of about 1 MB/s.
The total time spent in waiting for packets is 0.05 secs, completely negligible
wrt the total processing time (about 1200 s).
Are you sure that you read exactly the same amount of data and the same branches in the local job and in PROOF?
How do you set the cache parameters in the two cases?
I do not see anything wrong in what you do.
So, I do not understand the big performance difference.
Can you make a test switching off the TTreeCache in both cases?
In PROOF
proof->SetParameter("PROOF_UseTreeCache", 0);
In the local run
chain->SetCacheSize(0);
This may give hints if the problem is in the cache handling …
Can you also put in a public place one of the files you are analyzing so that we can have a look at the TTree structure and do a TTreePerfStat analysis?
I just finished with the test you suggested in the last post.
In general, If I deactivate the Cache I get worse results by a factor ~2 in time. In ~cosuna/public/Proof I put some plots that show the timing (all of them reading input data from a dcache server)
Timing_local_dcache_cache30MB.png -> running local with cache of 30MB.
Timing_Proof1Worker_dcache_cache30MB.png -> running on proof with 1 worker and cache of 30 MB.
Timing_local_dcache_nocache.png -> running local without the cache
Timing_Proof1Worker_dcache_nocache.png -> running on proof with 1 worker and without the cache.
I also generated the TTreePerfStats files
ioperf_dcache_cache30MB.root -> running local reading from dcache with a Cache of 30MB.
ioperf_dcache_nocache.root -> running local reading from dcache without Cache.
ioperf_localdisk_cache30MB.root -> running local reading from localdisk with a Cache of 30MB.
They tell me that the Cache is working well (running a local job) but unfortunately, I dont know how to produce the same TTreePerfStats info in proof (Using TTreePerfStats).
So how can I check if the TreeCache is working in proof?
anyhow deactivating the Cache when running locally the job may take 200 seconds, while sending the job to proof with 1 worker takes ~1200 seconds. So I still dont understand this behaviour.
The input chain is a list of files (some of them are really small). I put an example of a root input file on the same public path:
mc09_7TeV.107705_AlpgenJimmyWtaunuNp5_pt20_e511_s703_s730_r1097_r1113.root
Thanks for the files.
I have made a very basic test with PROOF-Lite on your files.
Attached is a very simple selector, reading the whole event and a macro to run it either as a local session or in PROOF-Lite with 1 worker.
With the file on my local disk (cold read, i.e. I release the memory cache after each run) I get:
root [0] .x runTest.C(kTRUE)
Real time 0:00:06.631180, CP time 4.460
for the local run, and
root [0] .x runTest.C(kFALSE)
 +++ Starting PROOF-Lite with 1 workers +++
Opening connections to workers: OK (1 workers)
Setting up worker servers: OK (1 workers)
PROOF set to parallel mode (1 worker)

Info in <TProofLite::SetQueryRunning>: starting query: 1
Looking up for exact location of files: OK (1 files)
Looking up for exact location of files: OK (1 files)
Info in <TPacketizerAdaptive::TPacketizerAdaptive>: Setting max number of workers per node to 1
Validating files: OK (1 files)
Info in <TPacketizerAdaptive::InitStats>: fraction of remote files 1.000000
+++e-0: merging output objects ... \ (1 workers still sending)
+++ #:1 ref:"pcphsft64-1279550339-25765:q1" sel:TestSelector finalized
+++        started:   Mon Jul 19 16:38:59 2010
+++        init time: 0.380 sec
+++        proc time: 4.961 sec (CPU time: 7.1 sec)
+++        processed: 3998 events (size: 10.614 MBs)
+++        rate:      805.9 evts/sec
+++        results:   <PROOF_SandBox>/queries/1/query-result.root
+++        outlist:   3 objects
Real time 0:00:08.483674, CP time 2.520
So, it takes a bit longer on PROOF but the run is very small and the weigh of the PROOF overhead is maximal.
Can you try on your local machine to see what you get?
Can you then run the same thing against the file in dCache?
Gerri
ps: to release the memory associated with the file, compile the file ‘releaseFileCache.cxx’
g++ releaseFileCache.cxx -o releaseFileCache
and then run './releaseFileCache ’ before each run. You need to run this when reading from dCache.
pps: do a couple of runs before taking the times, to eliminate the time in compiling TestSelector.C … runTest.tgz (24.5 KB)
I did a quick check with your selector. And well with local files I dont see significant difference between local and PROOF-lite with 1 worker (between 7 and 9 seconds).
But trying with the file on dcache, running local takes also ~10 seconds (not much more than local). But see what happens when using the PROOF-lite:
root [4] .x runTest.C(kFALSE,"dcap://dcgftp12.pic.es:22125//pnfs/pic.es/IFAEAtlasTier2/t2atlasscratchdisk/user/Carlos/Osun$
+++ Starting PROOF-Lite with 1 workers +++
Opening connections to workers: OK (1 workers)
Setting up worker servers: OK (1 workers)
PROOF set to parallel mode (1 worker)
Info in <TProofLite::SetQueryRunning>: starting query: 1
Looking up for exact location of files: OK (1 files)
Looking up for exact location of files: OK (1 files)
Info in <TPacketizerAdaptive::TPacketizerAdaptive>: Setting max number of workers per node to 1
Validating files: OK (1 files)
Info in <TPacketizerAdaptive::TPacketizerAdaptive>: fraction of remote files 1.000000
[TProof:] Total 3998 events    |====================| 100.00 % [433.9 evts/s]
+++e-0: merging output objects ... - (-1 workers still sending)
+++ #:1 ref:"italler001.pic.es-1279609819-30238:q1" sel:TestSelector finalized
+++        started:   Tue Jul 20 09:10:27 2010
+++        init time: 0.771 sec
+++        proc time: 9.215 sec (CPU time: 1.6 sec)
+++        processed: 3998 events (size: 4.595 MBs)
+++        rate:      433.9 evts/sec
+++        results:   <PROOF_SandBox>/queries/1/query-result.root
+++        outlist:   2 objects
Real time 0:01:39.022638, CP time 0.880
This was a quick check, now our dCache storage is in downtime, so I will continue with the tests this afternoon.
sorry for the delay, It took me some time to make all the tests to see If I could bring some results.
Let me summarize the timing results I got with your selector test class.
First, I change the input file, the one I gave you was too small, and timing fluctuations sometimes were of the order of the job time. So I took a bigger file with 2.7 M evt, 4.5 GB.
I tried with files located in the local disk and in dcache. For files placed locally I always get the same total time running local and in proof lite.
Now the differences appear when I run the job reading files from dCache. I tried several configurations: reading the tree and setting to 1 the BranchStatus of only 30 branches (out of 1100 branches in the tree)
So here are the timing results (more or less in average time):
[ Reading full tree ]
Local= 7:50 Proof = 15:10
[ BranchStatus==1 for 30 branches ]
Local = 1:30 Proof = 4:10
This is what happens most of the times, although I run the jobs many times, and I must say that in some exceptional cases I get proof-lite as fast as local.
Foor this tests I checked that the dcache file was not being kept in the system cache. For this I reset the cache
echo 3 > /proc/sys/vm/drop_caches
and check that running a second time over the same file takes the same time than the first time.
If you have other ideas or tests I can run, let me know. I dont have an idea of what can be the reason for this behaviour… maybe if someone else could try on a different dcache server.
This is of course puzzling. The only thing which is treated differently between the local case and PROOF is the TTreeCache (differently in the sense with a separate code). But the cache was switched off for these tests, right?
Do you have the possibility to make the same test reading the files from different remote server, like xrootd or http?
yes, no matter if I activate the Cache or not I see the same behaviour.
I dont have other disk servers to try, but what I will do is to try the xrootd door of the same dCache and in a few weeks we will upgrade the dCache version from 1.4 to 1.9.
Then I will try again the same tests, to see if I observe any change.
I’ve got the same behaviour using 24 core. I think that the problem is that the job is to easy. In the attached plot a dot is plotted when a worker execute the Process method. You can see large time gap between points of the same worker