Stat box cover the plot

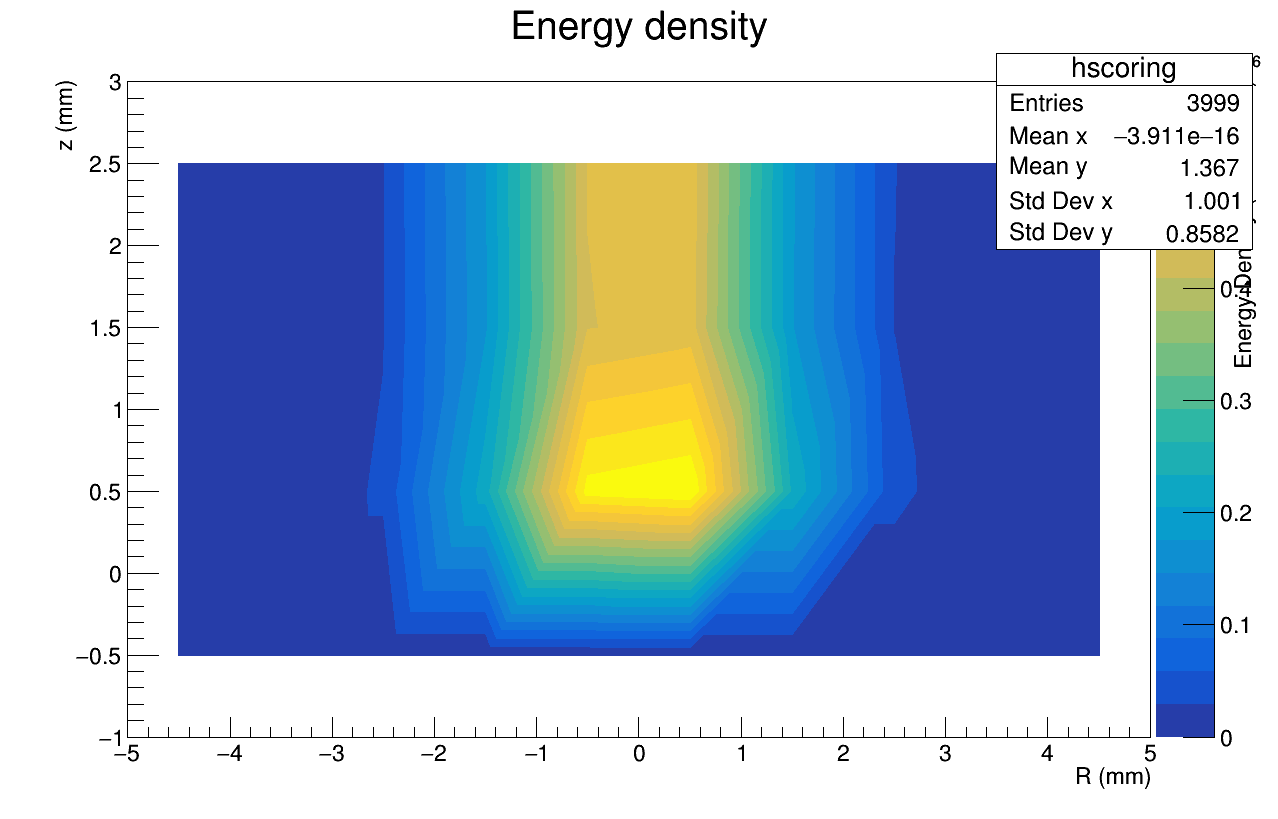
Hello, the stat box covers the color scale… is there a way to resize the plot, so that on the left I’ve the plot and on the right (out of the plot) I’ve the stat box?

data.txt (87.5 KB)

scorelemma.cpp (5.2 KB)

And one more question…is there a way to change the y-azis versus? and the x axis position? I mean… I would have the x axis on the top of the plot and the y axis versus pointing on the bottom (i.e. on the top I’ve negative numbers and on the bottom positive ones)
Thank you

   // ...
   TCanvas *c0 = new TCanvas("c0", canvtitle, 1280, 1024);
   c0->SetRightMargin(0.15);
   c_ZTitleOffsetTH3 = 1.2;
   // ...
   statshscoring->SetX1NDC(0.70); statshscoring->SetX2NDC(0.85);
   statshscoring->SetY1NDC(0.825); statshscoring->SetY2NDC(0.975);
   // ...

Thank you @Wile_E_Coyote …please, two more questions:

  1. The CONT4Z Cut a part of the plot…
    I mean My data are in the range [-4.975;4.975] on x axis and [0;3] on y axis…
    If I set

TH2F *hscoring = new TH2F("hscoring","Energy Density",10,-5,5,3,0,3);

I get this plot

the you see…Root doesn’t plot data in the [0;0.5] and in the [2.5;3] ranges on y-axis

then I had to set

TH2F *hscoring = new TH2F("hscoring","Energy Density",11,-6,6,3,-0.7,3.5);

to plot all data


but in this way, my y-axis starts from -0.7 instead of 0…
is there a way to solve it and using this drawing option?

  1. Is there a way to change the axis position and versus?
    Thank you

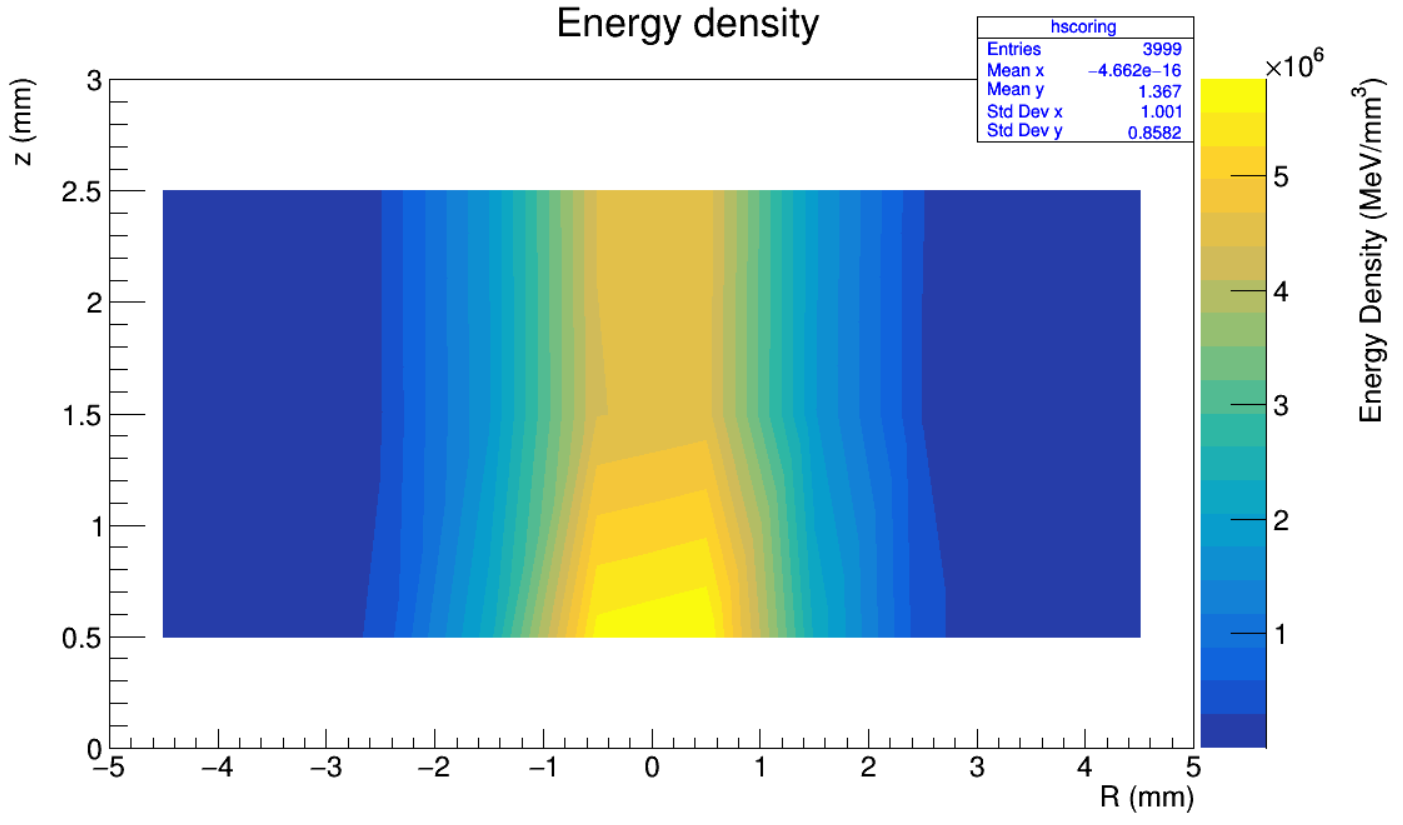
For “CONT4Z” (and “SURF1”), the first drawn “non-white pixels” correspond to “bin centers” of the “most external” bins.
If you want “entire bins” with colors, you need to use “COLZ”.

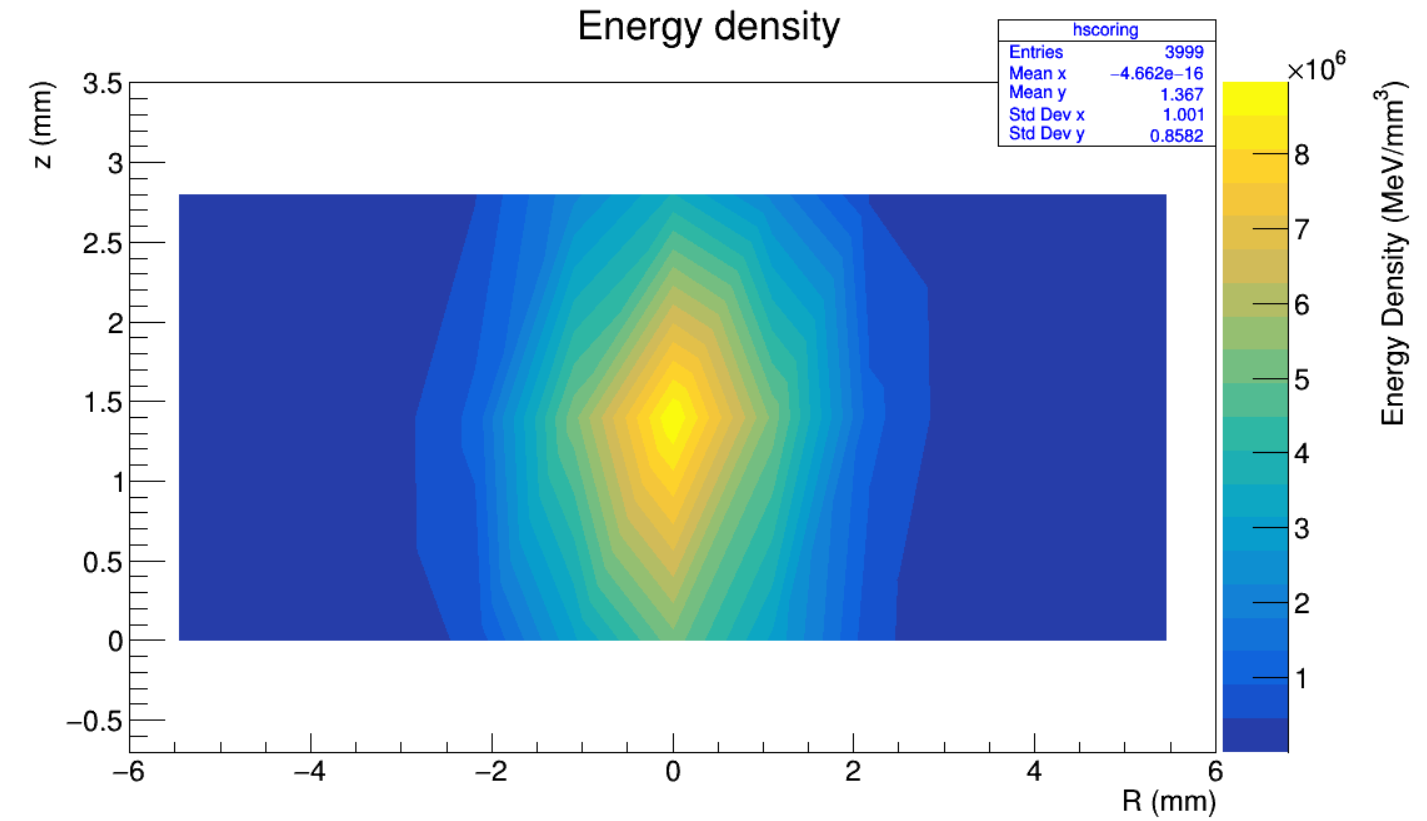
Looking more closely at your “data.txt” file, you should use (for the x-axis, instead of the “full precision” with 399 bins, you can use 133 or 57 or 21 or 19 or 7 or 3, and for the y-axis, instead of the “full precision” with 10 bins, you can use 5 or 2):

TH2F *hscoring =
  new TH2F("hscoring", "Energy Density",
           399, (-4.975 - 0.0125), (4.975 + 0.0125), // bin width = 0.025
           10, (0. - 0.15), (2.7 + 0.15)); // bin width = 0.3

You also need to talk to the author of your "data.txt” file. There seems to be a serious bug in it. All entries with x = 0 and y != 0 are present twice in this file (then the histogram bins with x = 0 are around 2 times higher than the neighboring ones).

1 Like

I see! thank you @Wile_E_Coyote

This topic was automatically closed 14 days after the last reply. New replies are no longer allowed.