This is now fixed. See sft.its.cern.ch/jira/browse/ROOT-4508
Your fix seems to work well in case the “h” histogram was manually created be the user. ![]()
There’s still a “display” problem in case when the automatically created “htemp” is used. 
In order to reproduce it, change the second “#if 1” into “#if 0” then run the macro. You will see all points drawn in the canvas. Then comment out BOTH lines “htemp->Get[XY]axis()->SetLimits([xy]min, [xy]max);” and execute the modified macro again and you will immediately see that 3 points with X <= 1 are missing in the canvas.
Ah yes you are right. It is not that the points are missing, it is limits which are not wide enough to let them appear.
It is a side effect due to the log scales.
If you turn off the log scales the points reappear.
I’ll check.
That was written in the original report, too. 
That was to refresh my mind … ![]()
I guess this is a “side effect” of the fact that “htemp->GetXaxis()->GetXmin()” returns 0 and then the procedure which creates the axis in logarithmic mode “misbehaves” (so this problem will appear for any histogram for which “Xmin == 0”, and it’s possible that the same will happen for the “Y” axis if “Ymin == 0”).
Yes very likely … I do not think it is connected to the other problem I fixed.
Anyway you example shows clearly the issue.
If I remember well … in the “old times”, also the point with the highest “X” was missing in the canvas, but some time ago (not that very long ago, several months maybe) you fixed something in the automatic procedure which calculates automatic axes limits and now this point is always present (but the 3 points with “X < 1” are still missing). But maybe I remember it wrong.
Yes may be. I have to refresh my mind on that. I am back from a vacations week and there is some urgent matters to look at.
This issue with log scale is now fixed.
Your fix seems to work well in case the “h” histogram was manually created be the user. ![]()
There’s still a “display” problem in case when the automatically created “htemp” is used.
In order to reproduce it, change the second “#if 1” into “#if 0” then run the macro. You will see all points drawn in the canvas. Then comment out BOTH lines “htemp->Get[XY]axis()->SetLimits([xy]min, [xy]max);” and execute the modified macro again and you will immediately see that the very first point with X = 0.20 is missing in the canvas.
BTW. I noticed that you increased the “Nbins[XY]” for the automatically created “htemp”. They are now both 40, instead of the old 20.
have you tried the fix I just committed ???
It sounds like you did not …
I am using the w.C example … with automatically created histo … and without or without COLZ I get the same scale on the two axis
nt->Draw(“b:a”, “”, “”); // note: TTree::Draw creates a “htemp”
or:
nt->Draw(“b:a:c”, “”, “colz”); // note: TTree::Draw creates a “htemp”
This was the problem. in case of COLZ the a:b:c distribution falls into a TH2 and therefore the number of bins along X and Y axis should be the same as a a:b distribution.
Well, that was my “report” for a v5-34-00-patches git clone as of 2014.08.04 11:18 UTC.
I’ve just found that I can reproduce the problem with the very first point ALSO in case the “h” histogram is manually created be the user.
It is sufficient to modify the source code using either:
Double_t xmin = 0;
or:
h->GetXaxis()->SetLimits(0, xmax);
So, this is, I think, the common problem which is visible in both cases (“h” and “htemp”). As soon as the “xmin” is 0 and “gPad->SetLogx(1);” is effective, the very first point will not be visible in the canvas.
And in case when the automatically created “htemp” is used, ROOT automatically sets “xmin” to 0 for it.
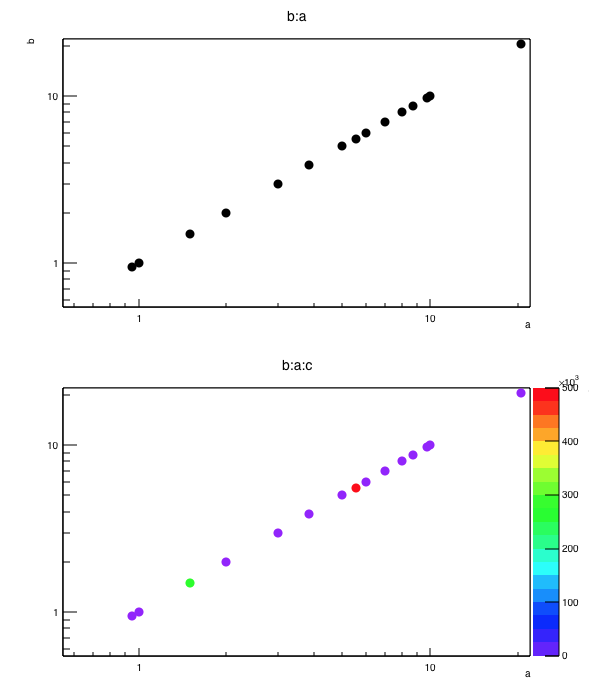
Attached is the very simple example I used to track the problem. Previously the bottom plot was missing points compare to the top plot. Please can you modify it, in order to show the problem you have in mind ?
Thanks.
w2.C (1.06 KB)
Try the attached macro 
(Note that the point at X = Y = 0.20 is missing in both plots in the upper row.)
w2.C (2.01 KB)
ok. I see … but at least the two plots behaves the same now … without or without COL (it was not the case before). I will investigate again this (other) problem.
I found a solution with the automatically created histogram. In that case we can define proper limits (ie not 0) in the Tree Drawing part (TSelectorDraw). That’s work nicely.
But if you set by hand the lower limits to 0 for the histogram after it was created or if you create your own histogram with 0 as lower limit, then we get the same problem: The THistPainter code sees that the lower limit is 0 … in log scale it tries to find a positive lower limit. But it excludes the lower point. I will try to find a solution. That’s a bit more tricky in THistPainter because the real minimum values (along x and y axis) of the data set are lost. A way would be to to loop over all the graphs in the histogram to find the minimum … that’s a bit heavy… another way would be to pass the “real minimum” from the tree machinery to THistPainter…
Assuming that there are many histograms which begin at X = 0 and you need to “loop” over them in order to find the “common-log-xmin” … for every histogram one could take the “1/2 of its very-first-bin upper-edge” as its “log-xmin” (will be a positive number) and then the “common-log-xmin” could be the “minimum” value of all these “log-xmin” values of all histograms.
What to do in case some historam begins at X < 0? Well, one could try to find its first bin which has a positive “upper-edge” (the “low-edge” of this bin will still be < 0 or = 0) and then simply take “1/2 * upper-edge” as its “log-xmin”.
Of course, instead of 1/2 one could take 1/3, 1/4, … whatever suits the THistPainter so that it paints the very first “positive-X” point, too.
(For historams which begin at X > 0, one simply takes the “low-edge” of their “very-first-bin” as the “log-xmin”, I assume.)