I am working with TMVA Rectangular Cuts method. Until now I have encountered with some problems.
- Wrong image of significance dependence on signal efficiency.
- Different values for signal and background at the implementation and application stages.
- The max and min ranges for cuts specified at the booking stage are not displaying correctly in
xmlfile.
Significance graph
After training and testing I use

via TMVA::GUI. After that I see the following bunch of graphs
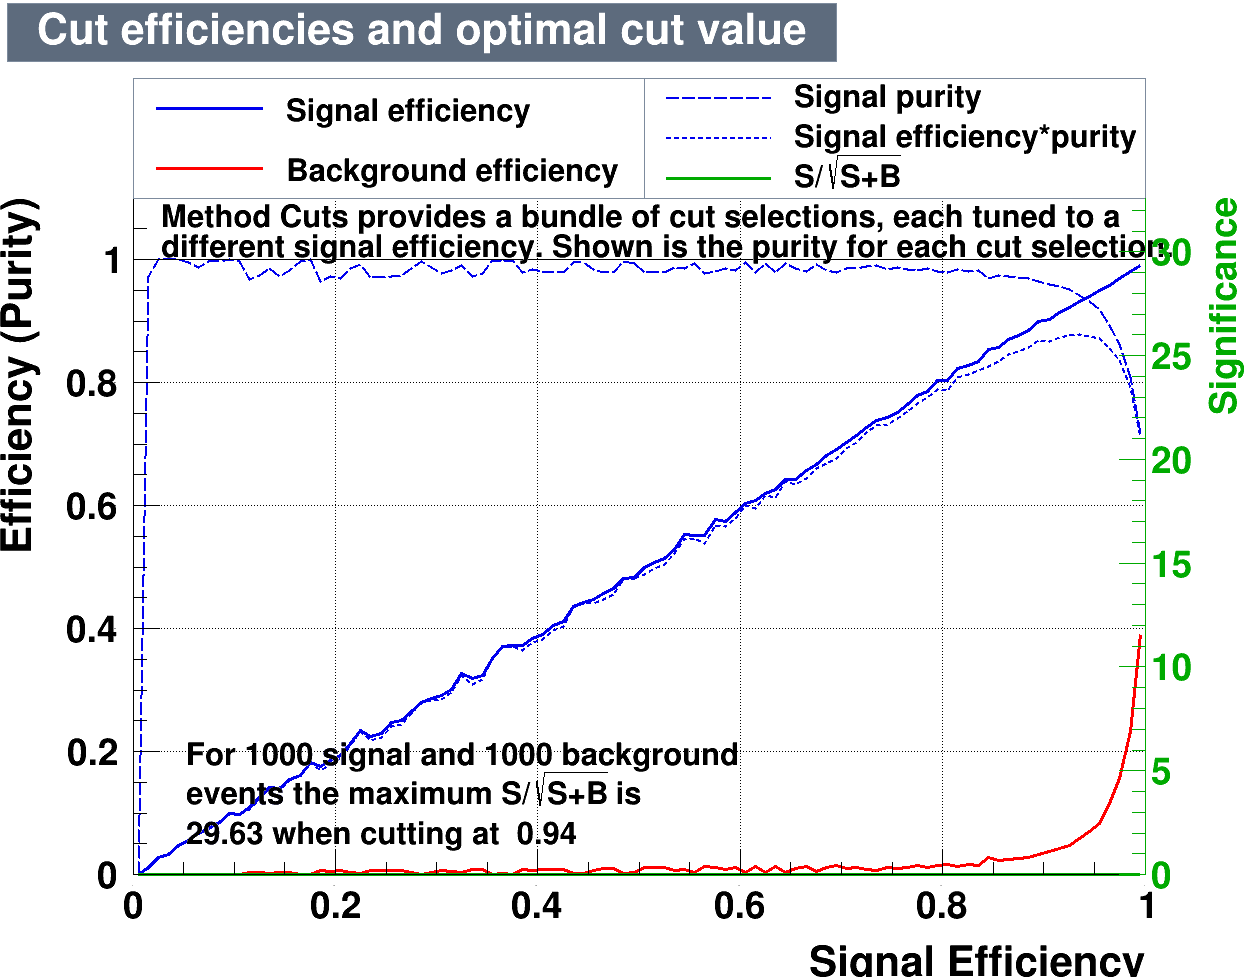
where obviously the green line is displayed wrong. Note that for
kNN classifier there is no such problem.EDIT: It seems there is such a problem only if one uses the Genetic Algorithm. For example, if try it with Monte Carlo the green line is normal displayed.
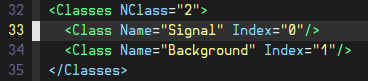
Signal and background values
After training I go to the xml file where the weights are storing and see the following:
In the application process I request the response of Cuts method:
    for ( Long64_t entry = 0; entry < nentries; entry++ )
    {
        analysedTree->GetEntry( entry );
        //Get TMVA response
        id = (Double_t)reader->EvaluateMVA( "Cuts", effS );
        //Fill hist
        Cuts_classID->Fill( id );
    }
    Cuts_classID->Write();
And it seems that it is 1 for signal and 0 for background. Very inconvenient.
Range for cuts
I specify ranges for cuts in this way:
factory->BookMethod( dataloader, TMVA::Types::kCuts, "Cuts", "FitMethod=GA:EffMethod=EffSel:CutRangeMin:CutRangeMax[0]=2500:CutRangeMax[1]=1500" );
but then in the xml file I see
And cuts values I see too high (bigger than specified) anyway.
Is it OK? How one should interpret this?
I would be thankful for any explanation or discussion on this matter.