I’m trying to create a histogram which draws the tick marks on the negative side of the Y axis. I’m doing this via:
h1->GetYaxis()->SetTicks("-");
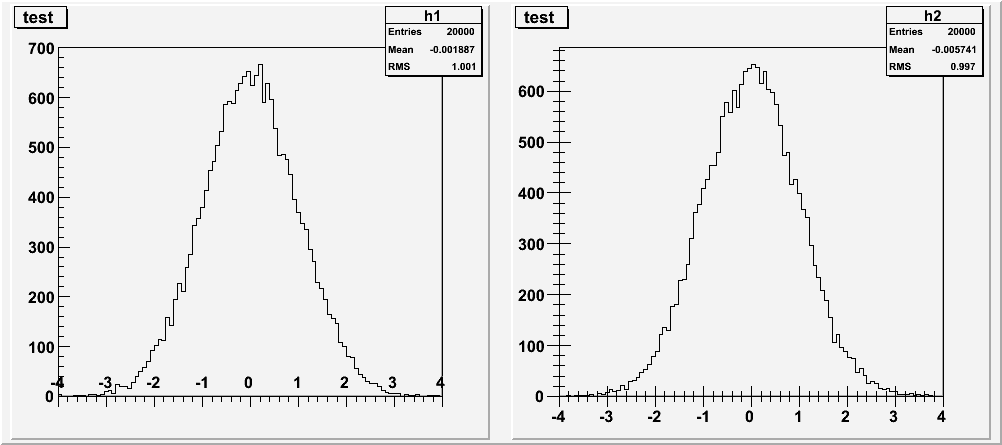
This works for the X-axis, but it puts the labels up into the data. This is not ideal behavior. The Y-axis doesn’t respond at all. I’m using root 5.18/5.19.
I’ve attached a small macro that reproduces the behavior as well as a png of it.
see this example. The simplest thing to do when you have this kind of problem is to use the graphics editor (see canvas “view” menu) , change the axis options using the GUI
and generate the canvas.C file from the canvas “File” menu.