Dear ROOT experts,
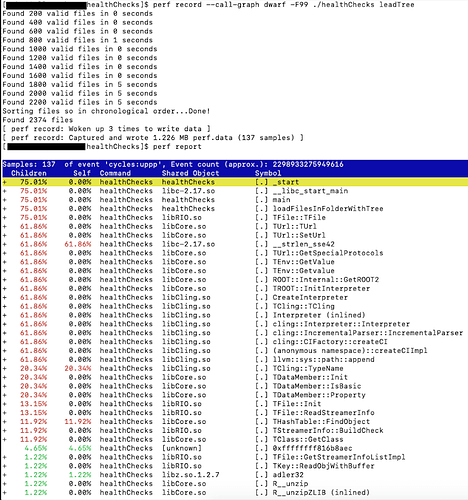
I’m having some issues with code slowing down when dealing with a large number of TFiles (~26,000). The code starts off quickly, but starts to slow down dramatically (by a factor of 5-6) after a few thousand files. The starting point of the slowdown is not consistent from run to run.
The first thing I would like to do is step through all root files in a folder, and add their filenames to a vector if they contain a TTree I’m looking for. I would like to process each file individually to get some quantities from them, and then plot the quantities for each file, so I am not using a TChain.
The function I am using to do this is shown below, where “dataPath” contains the ~26,000 files.
vector<TString> loadFilesInFolderWithTree(TString dataPath,TString treeName) {
DIR *dp;
struct dirent *dirp;
//Store file names in here if contain tree
vector<TString> rootFiles = {};
//We'll check the files in question have the correct ending
string fileEnding = string(".root");
//Check that we can open the folder
if (dp = opendir(dataPath.Data()) == NULL) {
cout << "Error(" << errno << ") opening " << dataPath << endl;
exit(-1);
}
//For demonstrating slow down
time_t start, current;
time(&start);
//List all files in folder, check if they have the specified ending
while ( (dirp = readdir(dp)) != NULL ) {
if ( string(dirp->d_name).find(fileEnding) != string::npos ) {
//Check this file has the proper TTree
TString filename=dirp->d_name;
TFile* runFile=TFile::Open(dataPath+filename,"READ");
if (runFile->GetListOfKeys()->Contains(treeName)) {
//Add to rootFiles vector if it contains the tree name
rootFiles.push_back(dirp->d_name);
//Print how long it is taking to add 200 files
if (rootFiles.size()%200==0) {
time(¤t);
cout<<"Found "<<rootFiles.size()<<" valid files in "<<double(current-start)<<" seconds"<<endl;
time(&start);
}
}
delete runFile;
}
}
//Close the DIR object
closedir(dp);
return rootFiles;
}
ROOT Version: 6.20/04
Platform: Ubuntu
Compiler: gcc 4.8.5
