I’m trying to display a RooPlot of an invariant mass distribution but I can’t get the Plot to display events from y=0. I have tried the following:
#Make my shapes (gaussian, exponential, etc)

#Make a list of them

#Then make my model
    model = ROOT.RooAddPdf("model" , "model", argList, normArgList)
    rHist = ROOT.RooDataHist("rHist", "rHist", ROOT.RooArgList(var), h)
    rHist.SetNameTitle("rHist" , T)

    model.fitTo(rHist)
#Make the frame
    frame = var.frame()

    rHist.plotOn(frame)

    for i in range(len(components)):
        model.plotOn(frame, ROOT.RooFit.Components(components[i]), ROOT.RooFit.LineColor(colours[i]), ROOT.RooFit.LineStyle(2))

    model.plotOn(frame)
    frame.SetMinimum(0)
This however does not display the y axis until 0. I have tried placing the #SetMinimum(0) before plotting the models onto the frame as well. Still does not work
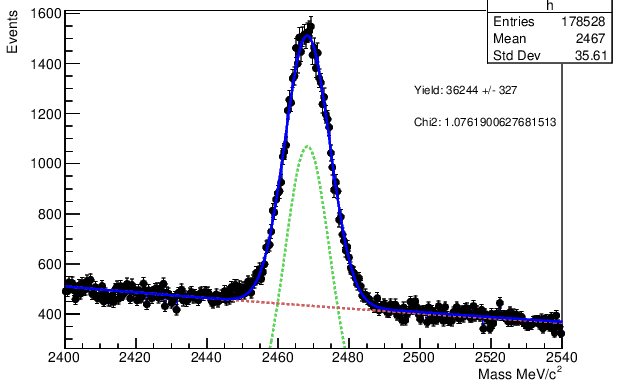
I have tried all the suggestions but as you can see, it does not go all the way to y = 0. is there some sort of override I must do in order to force it? because it seems to me that no matter what I do, ROOT just does not listen
@moneta, sorry I should have explained better. I believe the way my Nikhef account has been set does not allow me to scp files via the remote server and my local machine. Therefore I am not able to get the file and upload it. These plots were screenshots I took