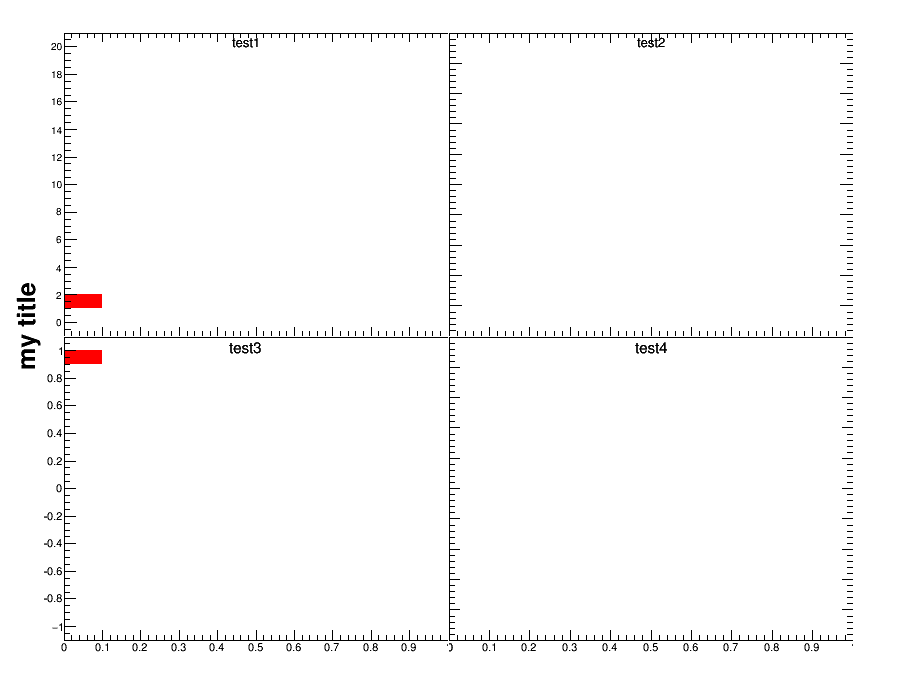
- You can adjust the axis ranges so that the lowest/highest labels are not at the edges; e.g. combining SetRangeUser, and you probably also need SetNdivisions.
- You can draw the title as TLatex, rotated 90 degrees. For several pads, you should probably draw it on the “base canvas”, but using the automatic canvas->Divide will not leave enough space, so you should draw the pads yourself leaving enough space on the left side of the canvas.
{
   TCanvas *c1 = new TCanvas("c1","multipads",900,700);
   gStyle->SetOptStat(0);

   TH2F *h1 = new TH2F("h1","test1",10,0,1,20,0,20);
   TH2F *h2 = new TH2F("h2","test2",10,0,1,20,0,100);
   TH2F *h3 = new TH2F("h3","test3",10,0,1,20,-1,1);
   TH2F *h4 = new TH2F("h4","test4",10,0,1,20,0,1000);
   h1->Fill(0,1);
   h3->Fill(0,.9);

   TLatex *tex = new TLatex();
   tex->SetTextSize(.05);
   tex->SetTextAngle(90);

   h1->GetYaxis()->SetRangeUser(-1,21);
   h1->GetYaxis()->SetNdivisions(520);
   h3->GetYaxis()->SetRangeUser(-1.1,1.1);
   h3->GetYaxis()->SetNdivisions(520);
   // ... h2... h4...

   TPad *p1 = new TPad("p1", "p1",0.05,0.5,0.5,0.95);
   p1->Draw();
   p1->cd();
   gPad->SetTickx(2);
   gPad->SetTopMargin(0);
   gPad->SetBottomMargin(0);
   gPad->SetLeftMargin(0.05);
   gPad->SetRightMargin(0);
   h1->Draw("col");

   c1->cd();
   TPad *p2 = new TPad("p2", "p2",0.5,0.5,0.95,0.95);
   p2->Draw();
   p2->cd();
   gPad->SetTickx(2);
   gPad->SetTicky(2);
   gPad->SetTopMargin(0);
   gPad->SetBottomMargin(0);
   gPad->SetLeftMargin(0);
   gPad->SetRightMargin(0);
   h2->GetYaxis()->SetLabelOffset(0.01);
   h2->Draw();

   c1->cd();
   TPad *p3 = new TPad("p3", "p3",0.05,0.0,0.5,0.5);
   p3->Draw();
   p3->cd();
   gPad->SetTopMargin(0);
   gPad->SetBottomMargin(0.1);
   gPad->SetLeftMargin(0.05);
   gPad->SetRightMargin(0);
   h3->Draw("col");

   c1->cd();
   TPad *p4 = new TPad("p4", "p4",0.5,0.0,0.95,0.5);
   p4->Draw();
   p4->cd();
   gPad->SetTicky(2);
   gPad->SetTopMargin(0);
   gPad->SetBottomMargin(0.1);
   gPad->SetLeftMargin(0);
   gPad->SetRightMargin(0);
   h4->Draw();

   c1->cd();
   tex->SetTextSize(.04);
   tex->DrawLatexNDC(.04,.45,"my title");
}