Hello,
I’m still a beginner and I’m sorry for this probably incredibly easy question, although I still don’t understand how to do it the best way. I use so far mainly the GUI for some simple tasks until I understand more…
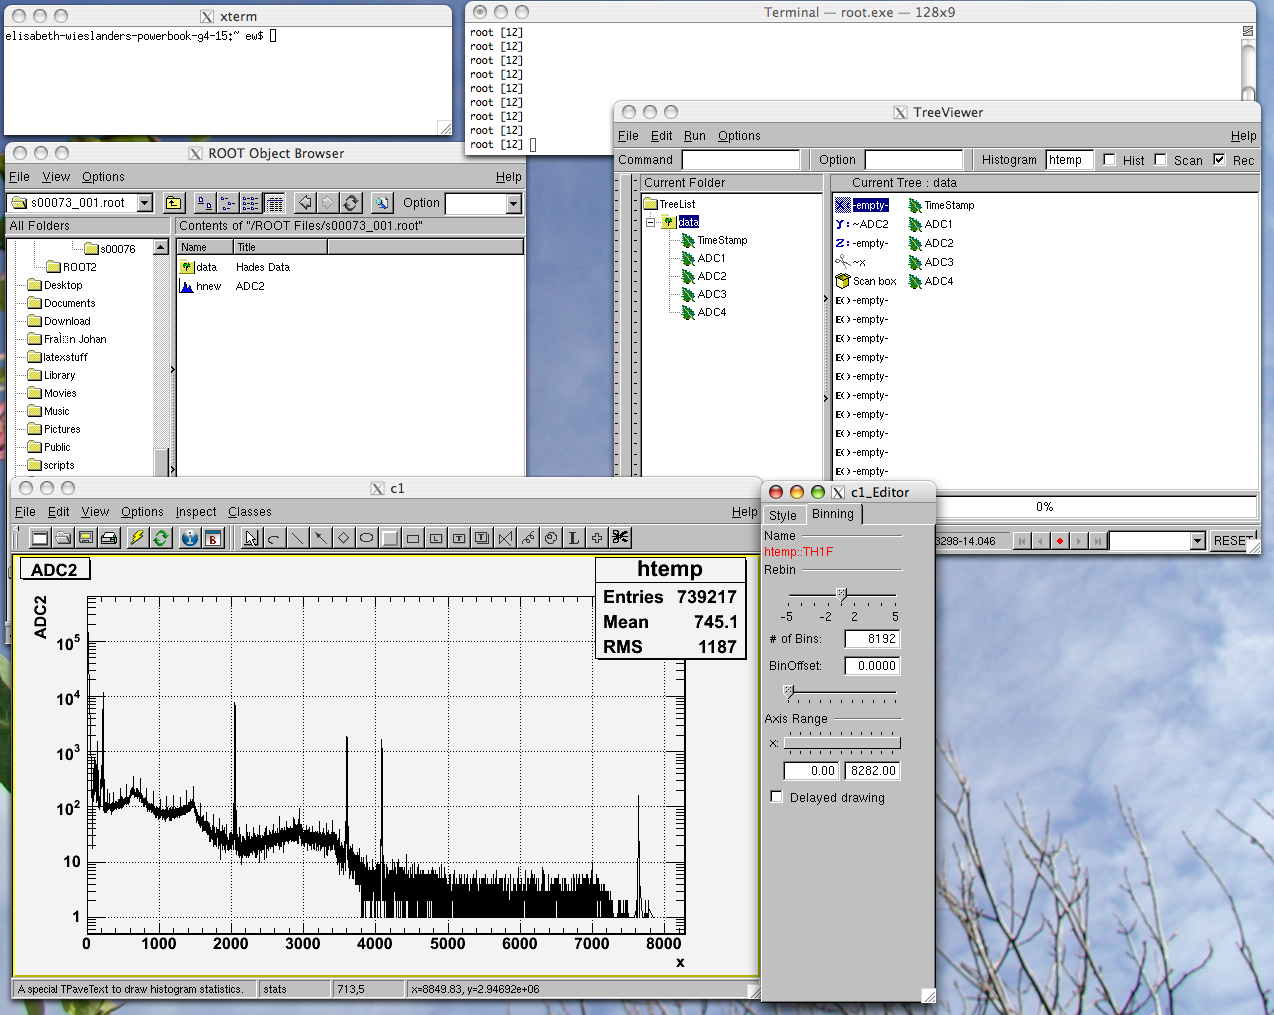
Attached is a picture with all the windows etc.
I have a Tree with 5 leafs: TimeStamp, ADC1, ADC2, ADC3 andADC4.
I plot the ADC2 on the Y-axis and set the binning to 8192 channels (which is the number of channels we have).
I would like to put the correct values on the x-axis and my expression is: x = 0.3298*Channel-14.046. : How do I do that?
I’ve looked in the tutorials + extra material I have in the office from a beginners course but I don’t find any hints… This would be an energy calibration for my spectrum and be used for all data from now on. I will use the same procedure for the other detectors (ADC2-4).
The x-axis in the figure shows 8192 bins. I have separately calculated that the linear function that will fit the peaks in the spectrum (it’s a calibration spectrum so I know them) is the one I mentionned. The Channel = the bin number = 1 to 8192… I hope that makes sense?
Or is there a better way to make an energy calibration of the spectrum’s x-axis? I know the peak energy of the 4 main peaks (59, 661, 1173 and 1332 keV) in the spectrum.
In the TreeViewer create an expression, eg (see HELP button)
e1= "0.3298*ADC1-14.046"
then drag&drop e1 to the x or y slot and click on the Draw button at the bottom left of the viewer.
Go to the canvas menu “View” and activate the option “EventStatusbar”, then move the mouse on to of the histogram, you will see the bin count displayed.
In command mode, you can query the bin content in the generated histogram with eg,
htemp->getBinContent(bin_number);
Yes I can see the status bar (I always have it on) and I wonder if the “Sum” that is shown there is the total sum of all counts up until that x-position or what is the definition of that sum?
Is there any easy way of getting the area (=total counts) in a peak, i.e. between two x-axis positions?
You can get the sum of all bins between bin1 and bin2.
-in the “stats” box (top right) using the context menu option “setstats” select eg “11111111”
-zoom the picture using the left mouse pointing just below the x axis to the first bin of the zoom region and release the button on the last point.
The stats box will report the sum in this area.
You can also activate the stats option via gStyle->setOptStat(11111111)