hi everybody,
i’d like to ask you if there’s a way to set the position of a graph inside its canvas.
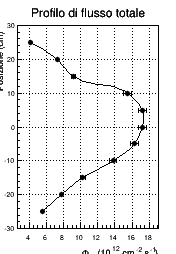
my problem is that I wrote a program that cuts the axis titles (see 2nd attachment), because their font size is too big. but i need them to be a bit bigger than usual.
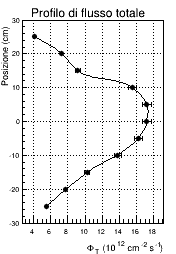
so i was thinking i can set the graph in order to show up closer to the up-right corner of the canvas (see first attachment). how can i do this without having to manually move the graph every time by mouse (as i did to make the 1st attachment…)?
thank you in advance for your help