Serious degradation of I/O performance from 6.20/04 to 6.22/06

,

Dear ROOT team,

We have experienced a quite serious I/O performance degradation, both in reading and writing, when switching from v6.20/04 to v6.22/06 for podio. You can see the degradation in this benchmark report. It is automatically generated, so the formatting is not as nice as it could be, and it additionally also contains a third benchmark case. Nevertheless, you should be able to see that the total read and write times for root are about a factor of 2 higher for 6.22/06 than for 6.20/04. This seems to be entirely driven by the times spent in I/O operations per event, which can be seen in the plots.

Are there any obvious changes to the default settings regarding I/O that could cause something like this? I have briefly looked at the release notes, but it is not entirely clear to me whether podio would be affected by these changes.

The relevant portions of the ROOTWriter should be these lines: https://github.com/AIDASoft/podio/blob/master/src/ROOTWriter.cc#L30-L49
What we are doing here is simply connecting some data buffers with the relevant branches before filling the TTree to which we write all the data. We have to “reconnect” these buffers for every event, because they are re-created and destroyed in each event, to “isolate” the writer and the rest of podio.

The corresponding call in ROOTReader can be found in these lines: https://github.com/AIDASoft/podio/blob/master/src/ROOTReader.cc#L45-L121
Here we read collections on demand, so for reading a whole event we would be calling this function multiple times. However, again what we do is similar to what we do when writing. We allocate several buffers and set the corresponding branch addresses for these buffers before we get the corresponding entry in the TTree. The ownership of these buffers is then again handed to podio, which takes care of cleaning them up.

Are these use cases expected to suffer performance wise? Maybe the “best way of doing things” has changed between the two releases and we should adapt our implementation? Or maybe it is really just adapting some settings that affect I/O performance?

Thanks,
Thomas

This is very unexpected and indeed there is no (intentional) change in the default behavior/recommendation. Could you provide profile information from 2 representative runs (one v6.20, one v6.22)? [For profiling, you can, for example, use perf both record --call-graph dwarf (to get sampling information) and valgrind --tool=callgrind (to get accurate call counts).

Is the slow down seen in single thread mode or multi-thread or both?

And THANK YOU for notifying us! Much appreciated! We do have benchmarks that allow us to pinpoint performance degradation, but this one hasn’t surfaced yet. Which means your report is even more valuable to us!

Thanks for the quick replies :slight_smile:

I have produced the perf outputs for the reading benchmark (read_benchmark.cpp)
and the write benchmark. The write benchmark is a bit more complicated and also involves a Delphes simulation, so it might also be a bit harder to interpret. I have used perf record --call-graph dwarf to record the data as both didn’t work in my case ('both' is not a perf-command. See perf --help).

To keep the sizes of the perf output data to a somewhat workable size I have limited the number of events to 1000 in both cases, but I can also provide the output for all roughly 17k events.

I have put the outputs on afs: /afs/cern.ch/user/t/thmadlen/public/root_perf_outputs/6.22.06/read/perf.data (replace 6.22.06 by 6.20.04 to arrive at the one for 6.20/04 and read by write to switch the benchmark).

I have had a brief look, but I must confess that my perf “parsing knowledge” is too limited to see an obvious reason for the differences.

We see the slow down in a single threaded application.

Let me know what else you need.

Cheers,
Thomas

Yep. My apologies, the word both and perf got flipped inadvertently in my text :frowning: … (I meant run both perf and valgrind)

Is the perf output for that run? And in that case, the valgrind output should also be very informative.

To help interpretation of the perf output, what is the “real” time and “user” time of both of the runs (for the runs that perf saw, so 1000 events).

When opening the perf output, I got:

Kernel address maps (/proc/{kallsyms,modules}) were restricted.   │
                                                                  │
Check /proc/sys/kernel/kptr_restrict before running 'perf record'.│
                                                                  │
As no suitable kallsyms nor vmlinux was found, kernel samples     │
can't be resolved.                                                │
                                                                  │
Samples in kernel modules can't be resolved as well.              │

and the content is missing the symbol names (it could just be me because I don’t have access to the libraries). I see a lot of:

+    2.60%     0.00%  DelphesSTDHEP_E  libTree.so.6.22.06             [.] 0x00007f6d73b85616
+    2.31%     0.00%  DelphesSTDHEP_E  libTree.so.6.22.06             [.] 0x00007f6d73b85645
+    2.17%     0.24%  DelphesSTDHEP_E  libstdc++.so.6.0.28            [.] std::use_facet<std::ctype<char> >
+    1.89%     0.00%  DelphesSTDHEP_E  libDelphes.so                  [.] 0x00007f6d73e711bd
+    1.88%     0.00%  DelphesSTDHEP_E  libDelphes.so                  [.] 0x00007f6d73e70199
+    1.87%     0.00%  DelphesSTDHEP_E  libDelphes.so                  [.] 0x00007f6d73e7016b
+    1.74%     0.00%  DelphesSTDHEP_E  libDelphes.so                  [.] 0x00007f6d73e71304
+    1.72%     0.00%  DelphesSTDHEP_E  libDelphes.so                  [.] 0x00007f6d73e702b1
+    1.72%     0.00%  DelphesSTDHEP_E  libDelphes.so                  [.] 0x00007f6d73e711ec
+    1.70%     0.00%  DelphesSTDHEP_E  [unknown]                      [k] 0xffffffff8d00008c

If you see a better ouput, please copy/paste and send it to me.

Nonetheless the top items in reading are:

v6.22

+    7.98%     7.96%  read_benchmark   libc-2.31.so            [.] __strcmp_avx2
+    5.25%     0.00%  read_benchmark   libc-2.31.so            [.] __GI___libc_malloc (inlined)
+    5.08%     0.43%  read_benchmark   libstdc++.so.6.0.28     [.] operator new
+    3.48%     0.00%  read_benchmark   libTree.so.6.22.06      [.] 0x00007f2a5d70b645
+    4.36%     0.00%  read_benchmark   libTree.so.6.22.06      [.] 0x00007f2a5d70b616

v6.20

+    4.59%     4.59%  read_benchmark   libc-2.31.so            [.] __strcmp_avx2
+    3.96%     0.00%  read_benchmark   libc-2.31.so            [.] __GI___libc_malloc (inlined)
+    3.79%     0.18%  read_benchmark   libstdc++.so.6.0.28     [.] operator new
+    3.73%     0.00%  read_benchmark   libTree.so.6.20.04      [.] 0x00007fa6da677fb8
+    3.55%     0.00%  read_benchmark   [unknown]               [k] 0xffffffff8d00008c

So the first 4 are taking a larger fraction of the time in v6.22 and hence are part of the slowdown.

For __strcmp_avx2 to take longer it needs to either:

  1. be processing longer strings
  2. be called more often
  3. spend more time fetching the memory

So

  1. is unlikely, it probably would require a change in input … or a bug …
  2. is plausible and callgrind would be able to tell if it is the case or not.
  3. would probably require the total memory usage to be much larger (or more fragmented memory.

for write
v6.22

+   11.14%     0.34%  DelphesSTDHEP_E  libstdc++.so.6.0.28            [.] std::basic_ios<char, std::char_traits<char> >::init
+   10.21%     0.52%  DelphesSTDHEP_E  libstdc++.so.6.0.28            [.] std::basic_ios<char, std::char_traits<char> >::_M_cache_locale
+    8.62%     5.29%  DelphesSTDHEP_E  libstdc++.so.6.0.28            [.] __dynamic_cast
+    6.12%     6.11%  DelphesSTDHEP_E  libc-2.31.so                   [.] __strcmp_avx2
+    5.56%     0.58%  DelphesSTDHEP_E  libstdc++.so.6.0.28            [.] operator new
+    5.35%     0.00%  DelphesSTDHEP_E  libc-2.31.so                   [.] __GI___libc_malloc (inlined)
+    3.24%     3.20%  DelphesSTDHEP_E  libc-2.31.so                   [.] _int_free

v6.20

+   13.03%     0.35%  DelphesSTDHEP_E  libstdc++.so.6.0.28            [.] std::basic_ios<char, std::char_traits<char> >::init
+   12.32%     0.67%  DelphesSTDHEP_E  libstdc++.so.6.0.28            [.] std::basic_ios<char, std::char_traits<char> >::_M_cache_locale
+   10.55%     6.63%  DelphesSTDHEP_E  libstdc++.so.6.0.28            [.] __dynamic_cast
+    4.41%     0.00%  DelphesSTDHEP_E  libc-2.31.so                   [.] __GI___libc_malloc (inlined)
+    4.37%     0.26%  DelphesSTDHEP_E  libstdc++.so.6.0.28            [.] operator new
+    3.49%     3.49%  DelphesSTDHEP_E  libc-2.31.so                   [.] __strcmp_avx2
+    3.03%     1.67%  DelphesSTDHEP_E  libstdc++.so.6.0.28            [.] __cxxabiv1::__vmi_class_type_info::__do_dyncast

Here the top 3 are taking less fraction of the time and thus other are responsible for the slowdown.

Here we see again that __strcmp_avx2 is taking more time. More surprisingly operator new is also taking more and (likely correlated) __int_free is taking much more time.

** Conclusions and questions

There are too many “anonymous” functions in the output to make a good comparisons. I do not know whether running with a RelWithDebInfo build would help but it is worth a try.

Since we have only the raw routine, getting a callgrind output would help us understand the direction.

The fact that string and allocation operation are on top is also making me wonder if we are not seeing the initialization phase being dominant in this “short” run.

So could you

  • try running with a debug build
  • publish the 17k event perfs
  • try running with callgrind (with the debug build), 1000 events or even 100 events should be enough there.

Cheers,
Philippe.

Hi Philippe,

I have run again using the full 17k events and the results below will be for that. I have uploaded the perf outputs to the same location as before, but at least on my machine they take a couple of minutes to open now. I have also disabled kptr_restrict to get rid of the warning you saw.
Just to make sure that our rather simple benchmarking instrumentation is not causing any problems I have also run the benchmarks again with that removed, but that didn’t make any real difference in runtime.

A few answers to dedicated questions:

To help interpretation of the perf output, what is the “real” time and “user” time of both of the runs (for the runs that perf saw, so 1000 events).

The real/user/sys times for 6.22/06 are (write | read)

real	0m27,221s  | 0m13,573s
user	0m26,787s  | 0m13,401s
sys 	0m0,408s   | 0m0,168s

The same for 6.20/04

real	0m20,950s  | 0m7,062s
user	0m20,532s  | 0m6,866s
sys 	0m0,381s   | 0m,193s

There are too many “anonymous” functions in the output to make a good comparisons. I do not know whether running with a RelWithDebInfo build would help but it is worth a try.

root and (almost everything else, apart from the read and write benchmark) are already built with RelWithDebInfo. I can see symbol names in the perf report, so I have attached txt files with the first page of perf report --no-children here for the four cases. As far as I can tell __strcmp_avx2 is still among those with the largest difference between the two, even with all 17k events.

  • try running with callgrind (with the debug build), 1000 events or even 100 events should be enough there.

I have added callgrind outputs to the same directories as the perf outputs. These use 100 events each.

I hope I got everything you need, otherwise please let me know.

Cheers,
Thomas

6.20.04.read.txt (4.9 KB) 6.20.04.write.txt (4.5 KB) 6.22.06.write.txt (4.5 KB) 6.22.06.read.txt (4.8 KB)

Hi Philippe,

I have done some “parallel debugging” and it seems that the first point where the two versions start to differ is when we are getting the branch from the TTree. Looking into the git history, it seems that root-project/root#5721 has introduced these changes and also changed the “order” in which branches are looked up. I am wondering whether we could be bitten by this, since we are looking for the branches in each event, and since we are always looking for the “outer most branch” a breadth first search naturally works best for our cases, because we are not interested in the “sub branches” that contain the data members of the classes that we are streaming.

This is my first time actually using a profiler outside of toy examples, so the following might be way off. What I have observed in the callgrind outputs is the following:

There are roughly twice as many calls to __strcmp_avx2 in 6.22/06 compared to 6.20/04 in the read benchmark. This seems to be due to a single function which calls it roughly twice as often (1.45M compared to 725k). Unfortunately this function is not resolved, but checking who calls this function reveals that in 6.20.04 all but one calls are from TTree::GetBranch, while for 6.22.06 lists 1.15M and 292k calls to R__GetBranch. I am not entirely sure, but the way I interpret is, that the first 1.15M calls are calls from within R__GetBranch. So this could be the recursion in the depth first search(?).

For the write benchmark the overall number of calls to __strcmp_avx2 is much larger, so the difference is smaller. However, there is also one unresolved function with about twice as many calls for 6.22/06 compared to 6.20/04 (1.8M vs 922k). Once again the callers of this unresolved function exhibit a similar pattern as above: The vast majority for 6.20/04 is to TTree::GetBranch, whereas for 6.22/06 there are again two entries for R__GetBranch (1.5M and 321k).

Would this observation fit to my suspicion that it is indeed the depth first search for the branches? Is there an easy way (i.e. without changing the implementation of TTree::GetBranch and recompiling root) to check this?

Cheers,
Thomas

Hi Thomas,

I think you are right on. Before more discussion on GetBranch, I also noted that there is an increase in SetAddressImpl and this one was fixed by commit c2594baf41aea6bf25fbc7bfb65ee32058fed9a3 which will be part of v6.22/08.

To test you hypothesis without recompiling ROOT, there is 2 similar solutions. One requiring only code changes and one that is a long terms solution.

Code change only.

Replace tree->GetBranch(branchname) with tree->GetListOfBranches()->FindObject(branchname) with the caveat that the name now needs to be exact (including the presence or absence of trailing dot) and need to cast the result to TBranch.

Also replace tree->SetBranchAddress(....) with the same branch lookup and a call to SetAddress.

Long term solution.

Call SetBranchAddress (now with 3 arguments) or GetBranch only once per TTree per branch and cache the TBranch pointer. Note: when using a TChain and SetBranchAddress(const char *bname,void *add, TBranch **ptr = 0), the TChain will update the TBranch pointer whenever it is called.

Then use the TBranch pointer to call SetAddress rather than SetBranchAddress.

Alternate long term solution (probably impractical but potentially the most efficient)

Instead of keep a pointer to the branch, you could keep a pointer per branch used to communicate the address of the data to branch. You can still destroy and recreate the object after each event but keep the pointer to stable. For example if you know the number of branches before hand you could have a simple vector<void*> that you resize to that number of branches and where you did

m_datatree->SetBranchAddress(name.c_str(), coll->getBufferAddress());

you would now do a one time:

m_datatree->SetBranchAddress(name.c_str(), &voidptr_vector[ index_of_branch] );

and for each event

voidptr_vector[ index_of_branch] = *(void**)coll->getBufferAddress(); 
or maybe just 
voidptr_vector[ index_of_branch] = coll; 

Final note

All 3 cases will reduce the total amount of work and thus to compare you will need to re-run with both 6.20 and 6.22 (and because of the other problem I noticed and mentioned earlier, v6.22 should still be slower but by much less. My guesstimate is that the slow down would be reduced by 2/3).

Cheers,
Philippe.

See also Shortcut in TTree::GetBranch for exact match to top level branches by pcanal · Pull Request #7253 · root-project/root · GitHub

Hi Philippe,

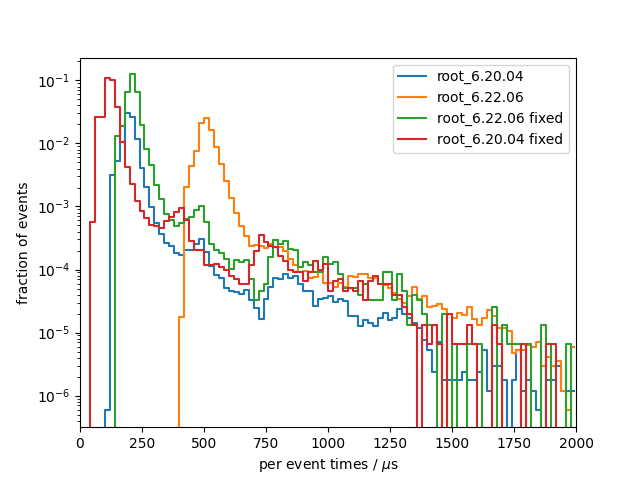
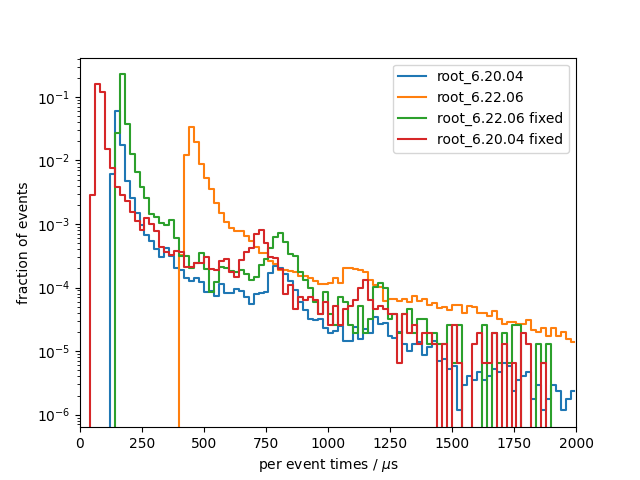
Thank you for your proposals. I have for now implemented the quick fix (your first solution) and that indeed seems to significantly speed up things for both versions:

Reading: per_event_read

Writing:
per_event_write

6.22/06 is now at the level of 6.20/04 before the fix. 6.20/04 has become faster by a about a factor of roughly 1.2 - 1.5, which aligns quite nicely with your estimate of the reduced residual 2/3 slowdown, I think.

If I understand correctly, this should be fixed by 6.22/08 or by using the Alternate long term solution, where we would only have to call SetBranchAddress once per branch.

The second long term solution, would speed up both solutions similarly, but would still not be able to completely get rid of the SetAddressImpl increase, right?

I am not entirely sure whether your alternate long term proposal is feasible for us (I think it should be), but if we would in any case could just wait for 6.22/08 to have that difference fixed as well, we might just go for your proposed long term solution.

Cheers,
Thomas

If I understand correctly, this should be fixed by 6.22/08 or by using the Alternate long term solution, where we would only have to call SetBranchAddress once per branch.

Yes. (almost … my estimate that there is 15% of the slowdown that I might not have accounted for (not found)).

The second long term solution, would speed up both solutions similarly, but would still not be able to completely get rid of the SetAddressImpl increase, right?

That is correct.

Note that the 3rd/alternate solution is the most efficient since it avoid the SetAddressImpl entirely (which even in the fast version does cost “something”) … and assuming that ‘calculating’ the index each time it is needed is done efficiently (of course :slight_smile: ).

Cheers,
Philippe.

Thanks for having such a detailed look into this. I think we have everything we need to implement the different proposals and see which one works best in our case.

However, what concerns the initial question of this thread, I think this can be considered solved.

Cheers,
Thomas

This topic was automatically closed 14 days after the last reply. New replies are no longer allowed.