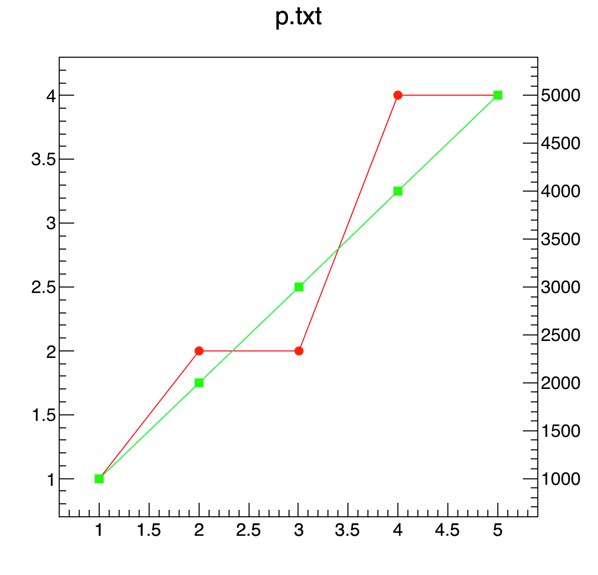
Dears,
I have added a second axis on a right side of the plot, simply doing:
axis = TGaxis(xmax2,ymin2,xmax2,ymax2,ymin2,ymax2,510,"+L");
This works well, the only problem is that I would like remove the thicks of the second axis which are drawn also on the first axis on the left side. How can I remove them?
I revised your code into a much shorter example (maybe not the smallest, but 4.5 times smaller than what you provided.) I do not have time to point out the issues at the moment, but the problem stems from the fact that you have multiple frames overlayed. Refer to the twoscales.C example for a solution to your task.
from ROOT import TCanvas, TGraph, TGaxis, TPad
name_file="p.txt"
# create first graph
gr = TGraph( name_file ,"%lg %lg" )
gr.SetLineColor(2)
gr.SetMarkerStyle(8)
gr.SetMarkerColor(2)
# create second graph
gr2 = TGraph( name_file ,"%lg %*s %lg" )
gr2.SetLineColor(3)
gr2.SetMarkerStyle(21)
gr2.SetMarkerColor(3)
# draw a frame to define the range
c1 = TCanvas("c1","c1",600,600)
xmin1 = 0
xmax1 = gr.GetX()[gr.GetN()-1]
ymin1 = 0
ymax1 = gr.GetHistogram().GetMaximum()
hr = c1.DrawFrame(xmin1,ymin1,xmax1,ymax1)
gr.Draw("LP")
#create a transparent pad drawn on top of the main pad
c1.cd()
overlay = TPad("overlay","overlay",0,0,1,1)
overlay.SetFrameFillStyle(4000)
overlay.Draw()
overlay.cd()
xmin2 = c1.GetUxmin()
xmax2 = c1.GetUxmax()
ymin2 = 0
ymax2=gr2.GetHistogram().GetMaximum()
hframe = overlay.DrawFrame(xmin2,ymin2,xmax2,ymax2)
hframe.GetXaxis().SetLabelOffset(99)
hframe.GetYaxis().SetLabelOffset(99)
gr2.Draw("LP")
#Draw an axis on the right side
axis = TGaxis(xmax2,ymin2,xmax2,ymax2,ymin2,ymax2,510,"+L")
axis.Draw()
c1.Update()
c1.SaveAs("P.png")
Thanks for your help! Of curse your macro is much better and smaller, the problem is that the result is the same, I still have the thicks of the 2nd axis also on the 1st axis.