Second axis, thicks drawn also in the first axis

Dears,
I have added a second axis on a right side of the plot, simply doing:
axis = TGaxis(xmax2,ymin2,xmax2,ymax2,ymin2,ymax2,510,"+L");

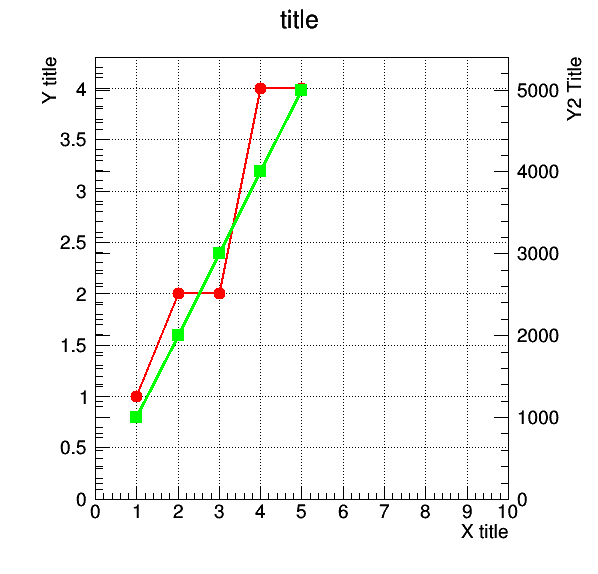
This works well, the only problem is that I would like remove the thicks of the second axis which are drawn also on the first axis on the left side. How can I remove them?

thanks a lot in advance :slight_smile:

I’m not sure what you mean? You see the tick marks from the new axis displayed over the old axis?
This is the behavior I observe in ROOT 6.10.04:

{
   TH1F *h = new TH1F("h","",100,-2,2);
   h->FillRandom("gaus",5000);
   h->SetStats(false);

   h->Draw();
   gPad->Update();

   double ymax = gPad->GetUymax();
   double ymin = gPad->GetUymin();
   double xpos = gPad->GetUxmax();
   TGaxis *newAxis = new TGaxis(xpos, ymin, xpos, ymax, ymin/3, ymax/3, 510, "+L");
   newAxis->SetTitle("Counts / 3");
   newAxis->Draw();
}

I’m using 6.07
Here an example


You see that on the first axis right side there are also the thick of the second axis… I would like to remove them.

thanks a lot :slight_smile:

Can you try this macro on 6.10/04?

I tried but same result

Can you provide us with the smallest example that produces this behavior?

of course, this is the pyROOT code: p.py (3.3 KB)

and the data example in input: p.txt (112 Bytes)

thanks a lot :slight_smile:

I revised your code into a much shorter example (maybe not the smallest, but 4.5 times smaller than what you provided.) I do not have time to point out the issues at the moment, but the problem stems from the fact that you have multiple frames overlayed. Refer to the twoscales.C example for a solution to your task.

from ROOT import TCanvas, TGraph, TGaxis, TPad
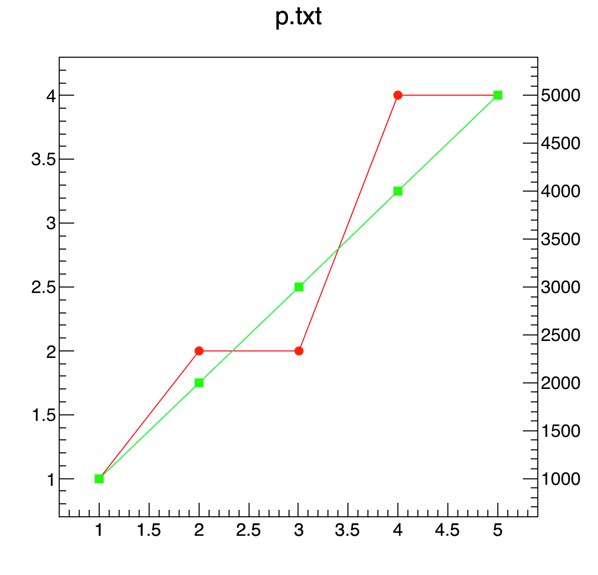
name_file="p.txt"

# create first graph
gr = TGraph( name_file ,"%lg %lg" )
gr.SetLineColor(2)
gr.SetMarkerStyle(8)
gr.SetMarkerColor(2)

# create second graph
gr2 = TGraph( name_file ,"%lg %*s %lg" )
gr2.SetLineColor(3)
gr2.SetMarkerStyle(21)
gr2.SetMarkerColor(3)

# draw a frame to define the range 
c1 = TCanvas("c1","c1",600,600)
xmin1 = 0
xmax1 = gr.GetX()[gr.GetN()-1]
ymin1 = 0
ymax1 = gr.GetHistogram().GetMaximum()
hr = c1.DrawFrame(xmin1,ymin1,xmax1,ymax1)
gr.Draw("LP")

#create a transparent pad drawn on top of the main pad
c1.cd()
overlay = TPad("overlay","overlay",0,0,1,1)
overlay.SetFrameFillStyle(4000)
overlay.Draw()
overlay.cd()

xmin2 = c1.GetUxmin()
xmax2 = c1.GetUxmax()
ymin2 = 0
ymax2=gr2.GetHistogram().GetMaximum()
hframe = overlay.DrawFrame(xmin2,ymin2,xmax2,ymax2)
hframe.GetXaxis().SetLabelOffset(99)
hframe.GetYaxis().SetLabelOffset(99)

gr2.Draw("LP")

#Draw an axis on the right side
axis = TGaxis(xmax2,ymin2,xmax2,ymax2,ymin2,ymax2,510,"+L")
axis.Draw()

c1.Update()
c1.SaveAs("P.png")

Thanks for your help! Of curse your macro is much better and smaller, the problem is that the result is the same, I still have the thicks of the 2nd axis also on the 1st axis.

thanks a lot :slight_smile:

Use TAttAxis::SetNdivisions(0).

...
hframe = overlay.DrawFrame(xmin2,ymin2,xmax2,ymax2)
hframe.GetXaxis().SetNdivisions(0)
hframe.GetYaxis().SetNdivisions(0)
...

An alternative using the "Y+" option (no frames or extra axes needed):

from ROOT import TCanvas, TGraph, TPad

name_file="p.txt"

# create first graph
gr = TGraph( name_file ,"%lg %lg" )
gr.SetLineColor(2)
gr.SetMarkerStyle(8)
gr.SetMarkerColor(2)

# create second graph
gr2 = TGraph( name_file ,"%lg %*s %lg" )
gr2.SetLineColor(3)
gr2.SetMarkerStyle(21)
gr2.SetMarkerColor(3)

c1 = TCanvas("c1","c1",600,600)
c1.cd()
gr.Draw("ALP")

overlay = TPad("overlay","overlay",0,0,1,1)
overlay.SetFrameFillStyle(4000) #Remove pad fill to see what's underneath
overlay.Draw()
overlay.cd()
gr2.Draw("ALPY+") #Draw Y axis on right side

c1.Update()
c1.SaveAs("P.png")

thanks a lot, now it wokrs!! :slight_smile:

This topic was automatically closed 14 days after the last reply. New replies are no longer allowed.