I have already try these options with TGraph2D but they do not produce the plots I am looking for as it seems to be producing some sort of binning. I only want the n points to be shown on that color palette scale.
My code is:
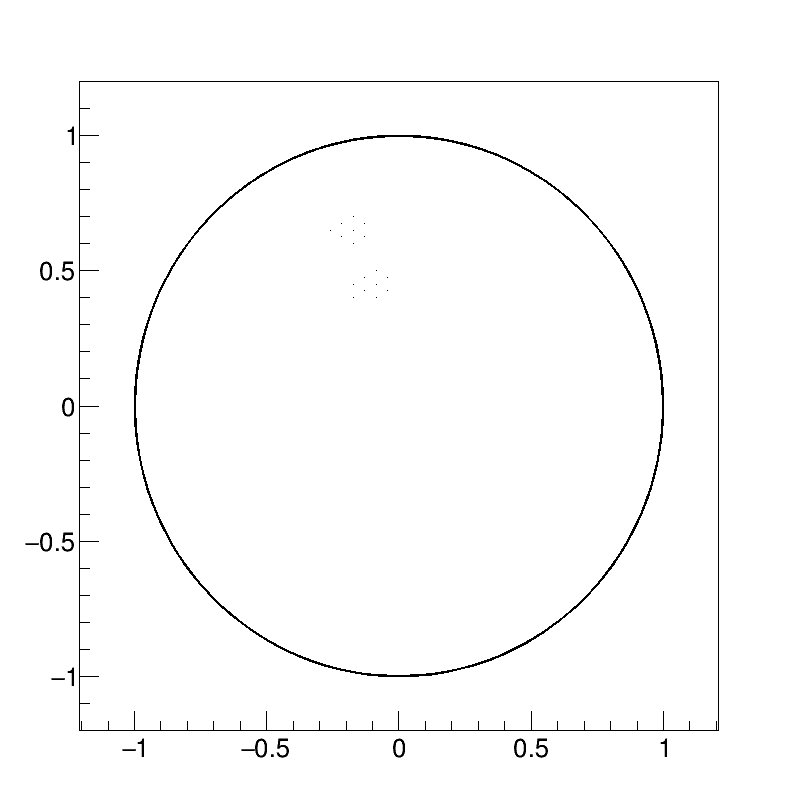
void images()
{
	TCanvas *c1 = new TCanvas("c1","c1",0,0,800,850);
        // drawing a circle
	double x[360], y[360];
	for (int i = 0; i < 360; ++i)
	{
		x[i]=cos(i);
		y[i]=sin(i);
	}
	TGraph* gr = new TGraph(360,x,y);
	gr->GetXaxis()->SetRangeUser(-1.2,1.2);
	gr->GetYaxis()->SetRangeUser(-1.2,1.2);
	gr->SetTitle("");
        gr->Draw("AC");

    double x_image[17] = {-0.086,-0.043,-0.173,-0.1299,-0.086,-0.043,-0.173,-0.1299,-0.086,-0.173,-0.1299,-0.216,-0.173,-0.1299,-0.2598,-0.216,-0.173};
    double y_image[17] = {0.4,0.425,0.4,0.425,0.45,0.475,0.45,0.475,0.5,0.6,0.625,0.625,0.65,0.675,0.65,0.675,0.7};
    double npe_image[17] = {7395,8678,553,8441,8864,8668,1944,4961,5319,5915,8781,4739,9005,5322,460,2795,881};

    TGraph *g = new TGraph(17,x_image,y_image);
    g->Draw("same p");
}
which produces the plot:
I want the tiny points in the circle to be colored based on the value of npe_image[i] with the color palette. Maybe I should have started with this.