Hi!
This is my first post here, so excuse me if it is a repeated question (although I searched for similar posts).
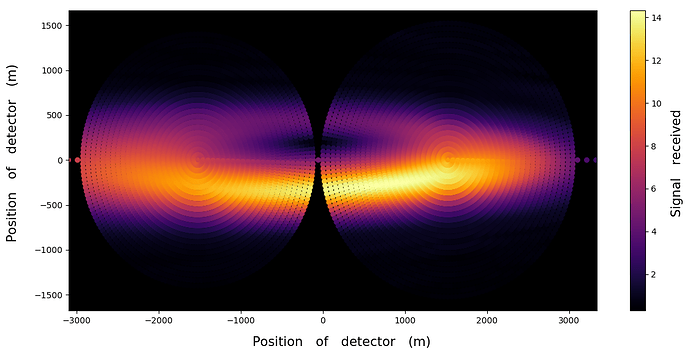
I am completely new with Root, and I started learning it with with pyroot. Right now, my project consists in making a TTree and fill it with branches (containing some parameters from simulation output files). The reading of that output files is made by a program in python that storages arrays (for example, position along x and y axis and signal detected) and I am interested in make a scatter-colored plot like the image below:
That figure was made by matplotlib.pyplot.scatter and I want to reproduce something similar with Pyroot and save it like .png and .root (if necessary to edit it in the future without losing time reading it again), any ideas for this?
I only found results for histograms and I must note that this is NOT a histogram (we have dispersed points with no “grid” or “matrix” correlation), just a “value” for each “(x,y) pair”.
Thanks in advance!


