Scatter plot with a third (character) coordinate

Hi Rooters,
I am trying to draw a scatter plot which visualizes, close to each marker, another information such as a char*.
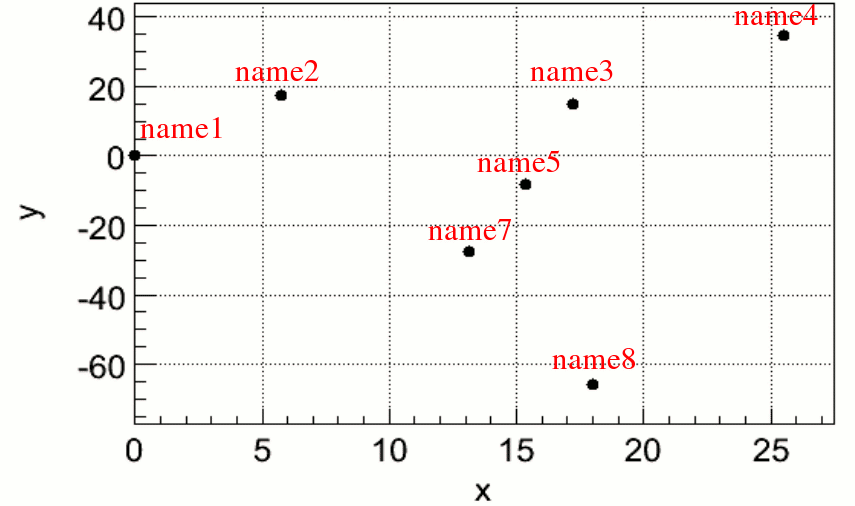
In other words I am trying to put a “name” close each point, as in the example below.
In this example I have written the red labels using an image editor but I would like to get this result automatically by Root… Is it possible?

I have tried to fill a TH3D object with the X coordinate, the Y coordinate and I fill the Z axis with the char* names. By using Draw() I get a 3-dimensional plot where names are (obviously) on the z-axis. Is there any way to project this information on the x-y axis as a text close to each marker?


see example below

Rene

[code]void graphlabel() {
const Int_t np = 7;
Double_t x[np] = { 0, 5.2, 17.5, 5, 15.1, 20, 12.5};
Double_t y[np] = { 0, 19, 16, -40, -7, -20, -30};
char *names[np]= {“name1”,“name2”,“name3”,“name4”,“name5”,“name6”,“name7”};

TCanvas *c1 = new TCanvas(“c1”);
c1->DrawFrame(0,-50,22,25);
c1->SetGridx();
c1->SetGridy();
TGraph *gr = new TGraph(np,x,y);
for (Int_t i=0;i<np;i++) {
TLatex *t = new TLatex(x[i]+0.1,y[i]+1,names[i]);
t->SetTextAngle(22);
t->SetTextSize(0.03);
t->SetTextColor(kRed);
gr->GetListOfFunctions()->Add(t);
}
gr->SetMarkerStyle(20);
gr->SetMarkerSize(1.5);
gr->Draw(“p”);
}
[/code]