Hi ROOT experts,
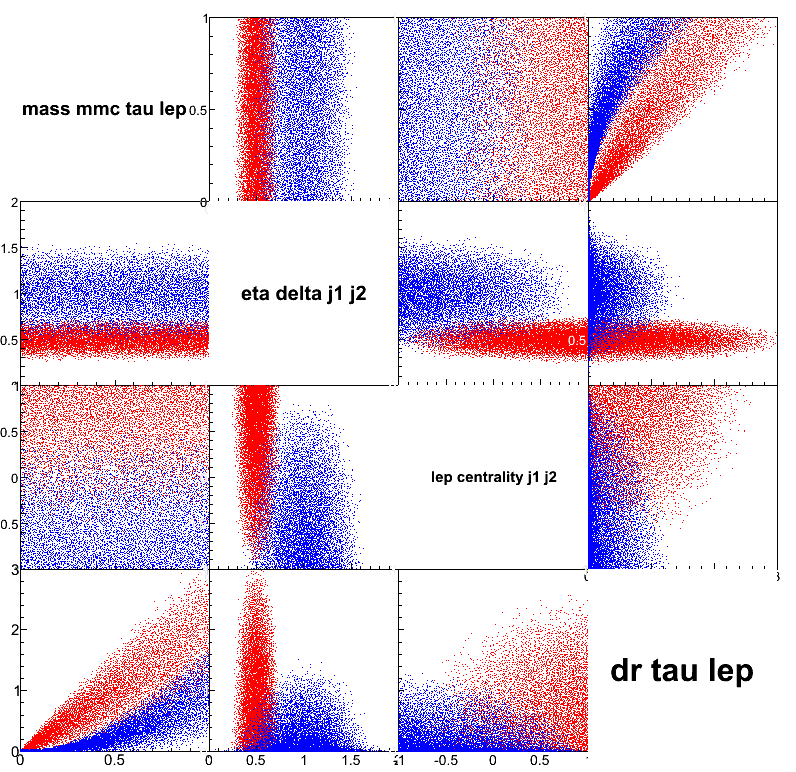
I’ve been working on a scatter plot matrix (for multivariate problems). I have all the logistics figured out, and now comes the time to make the thing look pretty (see attached). I’m having trouble doing a number of things for which I was hoping to get some advice.
-
I would like to extend the margins of the main canvas pad on the left and bottom sides to leave some space for the axis labels. I tried using SetMargin() on canvas.cd(0) but it has no effect, either before or after I do canvas.Divide().
-
I would like the diagonal pads to really be transparent, or at least be drawn last when I do canvas.Print(). The goal is to display the x-axis at the bottom of the last column, which happen to always be hidden by the very last pad on the diagonal. I tried making them transparent with SetFillColor(0) and SetFillStyle(0) to no effect.
-
I would like to control the axis labels in such a way that I never get labels at the two extremes of an axis. The problem is that neighbouring pads at the bottom of the matrix are trying to display numbers at the same spot and it just looks silly.
-
And finally, but this is a minor case, Is there any other way to not display axis labels than setting their color to kWhite or hoping that the order in which the pads are drawn is going to make them disappear?
Any help is much appreciated. Thanks!
Michel.
testScatterMatrix.py (1.01 KB)
scattermatrix.py (5.91 KB)