ROOT Version: 6.26/04
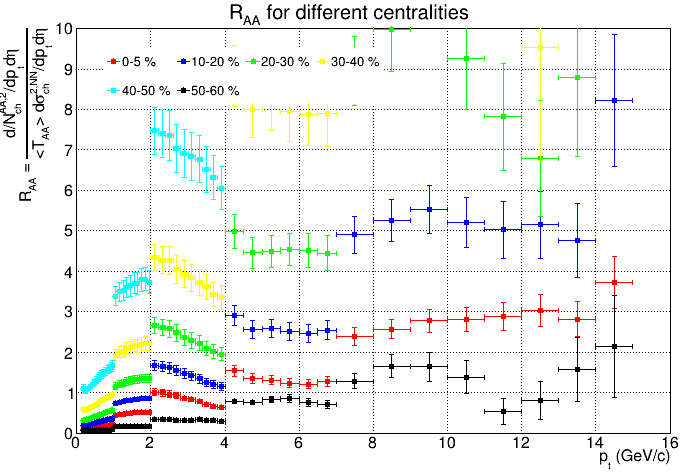
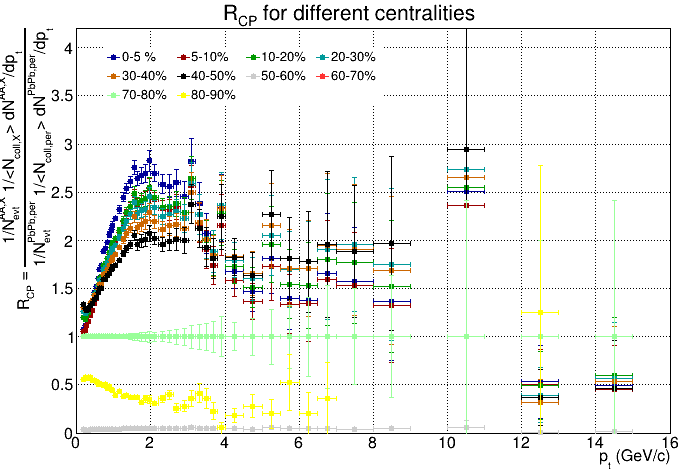
Hello everyone! I’m working on making the graphs for RAA (nuclear modification factor of Pb-Pb Collisions) and RCP (nuclear modification factor central-peripheral). In the process of filling the histograms with the trackPt and the centrality when i’m scaling the histograms using the factor of nColl, calculated by the Glauber Model, the values in the graph seems a little bit greater than 1 (most specially for the RAA graph vs different centralities) and also the RAA graph seems like it’s cut for given values. Is there another form of making scaling much better for the graphs?
 //*********************************************************************************
  //Attaching & reading the input-file
  //*********************************************************************************

   TFile fileInput(filename.Data());
  //____ reading the number of TPC tracks for pp events & 0-5% PbPb events___________
  TH1D *hNTracksTPCPbPb_0_5 =			(TH1D*)fileInput.Get(Form("nTracksTPC_PbPb_0-5",0,100));
  TH1D *hNTracksTPCPbPb_70_80 =		(TH1D*)fileInput.Get(Form("nTracksTPC_PbPb_70-80",0,100));
  /// To do: Do the same for the other centralities
  TH1D *hNTracksTPCPbPb_5_10 =               (TH1D*)fileInput.Get(Form("nTracksTPC_PbPb_5-10", 0,100));
  TH1D *hNTracksTPCPbPb_10_20 =               (TH1D*)fileInput.Get(Form("nTracksTPC_PbPb_10-20", 0,100));
  TH1D *hNTracksTPCPbPb_20_30 =               (TH1D*)fileInput.Get(Form("nTracksTPC_PbPb_20-30", 0,100));
  TH1D *hNTracksTPCPbPb_30_40 =               (TH1D*)fileInput.Get(Form("nTracksTPC_PbPb_30-40", 0,100));
  TH1D *hNTracksTPCPbPb_40_50 =               (TH1D*)fileInput.Get(Form("nTracksTPC_PbPb_40-50", 0,100));
  TH1D *hNTracksTPCPbPb_50_60 =               (TH1D*)fileInput.Get(Form("nTracksTPC_PbPb_50-60", 0,100));
  TH1D *hNTracksTPCPbPb_60_70 =               (TH1D*)fileInput.Get(Form("nTracksTPC_PbPb_60-70", 0,100));
  TH1D *hNTracksTPCPbPb_80_90 =               (TH1D*)fileInput.Get(Form("nTracksTPC_PbPb_80-90", 0,100));

  //_____reading the pt-spectrum for 0-5% & 70-80% PbPb events, scaling it___________
  //_____by corresponding number of Collisions (nColl)_______________________________
  TH1D *hTrackPtPbPb_0_5 =			(TH1D*)fileInput.Get(Form("trackPt_PbPb_0-5",0,5));
  hTrackPtPbPb_0_5-> Scale(1./nColl_0_5);

  TH1D *hTrackPtPbPb_70_80 =			(TH1D*)fileInput.Get(Form("trackPt_PbPb_70-80",0,100));
  hTrackPtPbPb_70_80-> Scale(1./nColl_70_80);
  /// To do: Do the same for the other centralities
  TH1D *hTrackPtPbPb_5_10 =			(TH1D*)fileInput.Get(Form("trackPt_PbPb_5-10",0,100));
  hTrackPtPbPb_5_10-> Scale(1./nColl_0_10);

  TH1D *hTrackPtPbPb_10_20 =                   (TH1D*)fileInput.Get(Form("trackPt_PbPb_10-20",0,100));
  hTrackPtPbPb_10_20 -> Scale(1./nColl_10_20);

  TH1D *hTrackPtPbPb_20_30 =                   (TH1D*)fileInput.Get(Form("trackPt_PbPb_20-30",0,100));
  hTrackPtPbPb_20_30 -> Scale(1./nColl_20_30);

  TH1D *hTrackPtPbPb_30_40 =                   (TH1D*)fileInput.Get(Form("trackPt_PbPb_30-40",0,100));
  hTrackPtPbPb_30_40 -> Scale(1./nColl_30_40);

  TH1D *hTrackPtPbPb_40_50 =                   (TH1D*)fileInput.Get(Form("trackPt_PbPb_40-50",0,100));
  hTrackPtPbPb_40_50 -> Scale(1./nColl_40_50);

  TH1D *hTrackPtPbPb_50_60 =                   (TH1D*)fileInput.Get(Form("trackPt_PbPb_50-60",0,100));
  hTrackPtPbPb_50_60 -> Scale(1./nColl_50_60);

  TH1D *hTrackPtPbPb_60_70 =                   (TH1D*)fileInput.Get(Form("trackPt_PbPb_60-70",0,100));
  hTrackPtPbPb_50_60 -> Scale(1./nColl_60_70);

  TH1D *hTrackPtPbPb_80_90 =                   (TH1D*)fileInput.Get(Form("trackPt_PbPb_80-90",0,100));
  hTrackPtPbPb_80_90 -> Scale(1./nColl_80_90);

  //*********************************************************************************
  // Attaching and Reading pp-reference file
  //*********************************************************************************
  TFile *fileInputPP   = new TFile("PP_2760GeV_BaseLine.root");
  TH1F  *hNTracksTPCpp = (TH1F*)fileInputPP->Get("nTracksTPC_pp");
  TH1D  *hTrackPtpp    = (TH1D*)fileInputPP->Get("trackPt_pp");

  //*********************************************************************************
  // Building the RCP
  //*********************************************************************************
  TH1D*	hRCP_0_5 = (TH1D*)hTrackPtPbPb_0_5->Clone("RCP_vs_Pt_0-5");
  hRCP_0_5->Sumw2();
  hRCP_0_5->Divide(hTrackPtPbPb_70_80);
  /// To do: Do the same for the other centralities
  TH1D*        hRCP_5_10 = (TH1D*)hTrackPtPbPb_5_10 ->Clone("RCP_vs_Pt_5-10");
  hRCP_5_10 -> Sumw2();
  hRCP_5_10->Divide(hTrackPtPbPb_70_80);

  TH1D*        hRCP_10_20 = (TH1D*)hTrackPtPbPb_10_20 -> Clone("RCP_vs_Pt_10-20");
  hRCP_10_20 -> Sumw2();
  hRCP_10_20 -> Divide(hTrackPtPbPb_70_80);

  TH1D*        hRCP_20_30 = (TH1D*)hTrackPtPbPb_20_30 -> Clone("RCP_vs_Pt_20-30");
  hRCP_20_30 -> Sumw2();
  hRCP_20_30 -> Divide(hTrackPtPbPb_70_80);

  TH1D*        hRCP_30_40 = (TH1D*)hTrackPtPbPb_30_40 -> Clone("RCP_vs_Pt_30-40");
  hRCP_30_40 -> Sumw2();
  hRCP_30_40 -> Divide(hTrackPtPbPb_70_80);

  TH1D*        hRCP_40_50 = (TH1D*)hTrackPtPbPb_40_50 -> Clone("RCP_vs_Pt_40-50");
  hRCP_40_50 -> Sumw2();
  hRCP_40_50 -> Divide(hTrackPtPbPb_70_80);

  TH1D*        hRCP_50_60 = (TH1D*)hTrackPtPbPb_50_60 -> Clone("RCP_vs_Pt_50-60");
  hRCP_50_60 -> Sumw2();
  hRCP_50_60 -> Divide(hTrackPtPbPb_70_80);

   TH1D*        hRCP_60_70 = (TH1D*)hTrackPtPbPb_60_70 -> Clone("RCP_vs_Pt_60-70");
  hRCP_60_70 -> Sumw2();
  hRCP_60_70 -> Divide(hTrackPtPbPb_70_80);

  TH1D*        hRCP_70_80 = (TH1D*)hTrackPtPbPb_70_80 -> Clone("RCP_vs_Pt_70-80");
  hRCP_70_80 -> Sumw2();
  hRCP_70_80 -> Divide(hTrackPtPbPb_70_80);

  TH1D*        hRCP_80_90 = (TH1D*)hTrackPtPbPb_80_90 -> Clone("RCP_vs_Pt_80-90");
  hRCP_80_90 -> Sumw2();
  hRCP_80_90 -> Divide(hTrackPtPbPb_70_80);


  //*********************************************************************************
  // Building the RAA
  //*********************************************************************************

 /// To Do: Here you need to add the histograms for RAA (PbPb-pt-spectrum in a certain centrality, scaled by NColl,  devided by the pp reference spectrum

  TH1D*	hRAA_0_5 = (TH1D*)hTrackPtPbPb_0_5->Clone("RAA_vs_Pt_0-5");
  hRAA_0_5 ->Scale(1./(10.*nColl_0_5));
  hRAA_0_5->Sumw2();
  hRAA_0_5->Divide(hTrackPtpp);


  TH1D*	hRAA_10_20 = (TH1D*)hTrackPtPbPb_10_20->Clone("RAA_vs_Pt_10-20");
  hRAA_10_20 ->Scale(1./(10.*nColl_10_20));
  hRAA_10_20->Sumw2();
  hRAA_10_20->Divide(hTrackPtpp);


  TH1D*	hRAA_20_30 = (TH1D*)hTrackPtPbPb_20_30->Clone("RAA_vs_Pt_20-30");
  hRAA_20_30 ->Scale(1./(10.*nColl_20_30));
  hRAA_20_30->Sumw2();
  hRAA_20_30->Divide(hTrackPtpp);


  TH1D*	hRAA_30_40 = (TH1D*)hTrackPtPbPb_30_40->Clone("RAA_vs_Pt_30-40");
  hRAA_30_40 ->Scale(1./(10.*nColl_30_40));
  hRAA_30_40->Sumw2();
  hRAA_30_40->Divide(hTrackPtpp);


  TH1D*	hRAA_40_50 = (TH1D*)hTrackPtPbPb_40_50->Clone("RAA_vs_Pt_40-50");
  hRAA_40_50 ->Scale(1./(10.*nColl_40_50));
  hRAA_40_50->Sumw2();
  hRAA_40_50->Divide(hTrackPtpp);


  TH1D*	hRAA_50_60 = (TH1D*)hTrackPtPbPb_50_60->Clone("RAA_vs_Pt_50-60");
  hRAA_50_60 ->Scale(1./(10.*nColl_50_60));
  hRAA_50_60->Sumw2();


  hRAA_50_60->Divide(hTrackPtpp);
Images of the graphs.