Hey ,
Im plotting this sinc function(sin(x)/x) using TF1 class,
when I plot it for the short range it gives me the accurate result (value 1 at x=0).
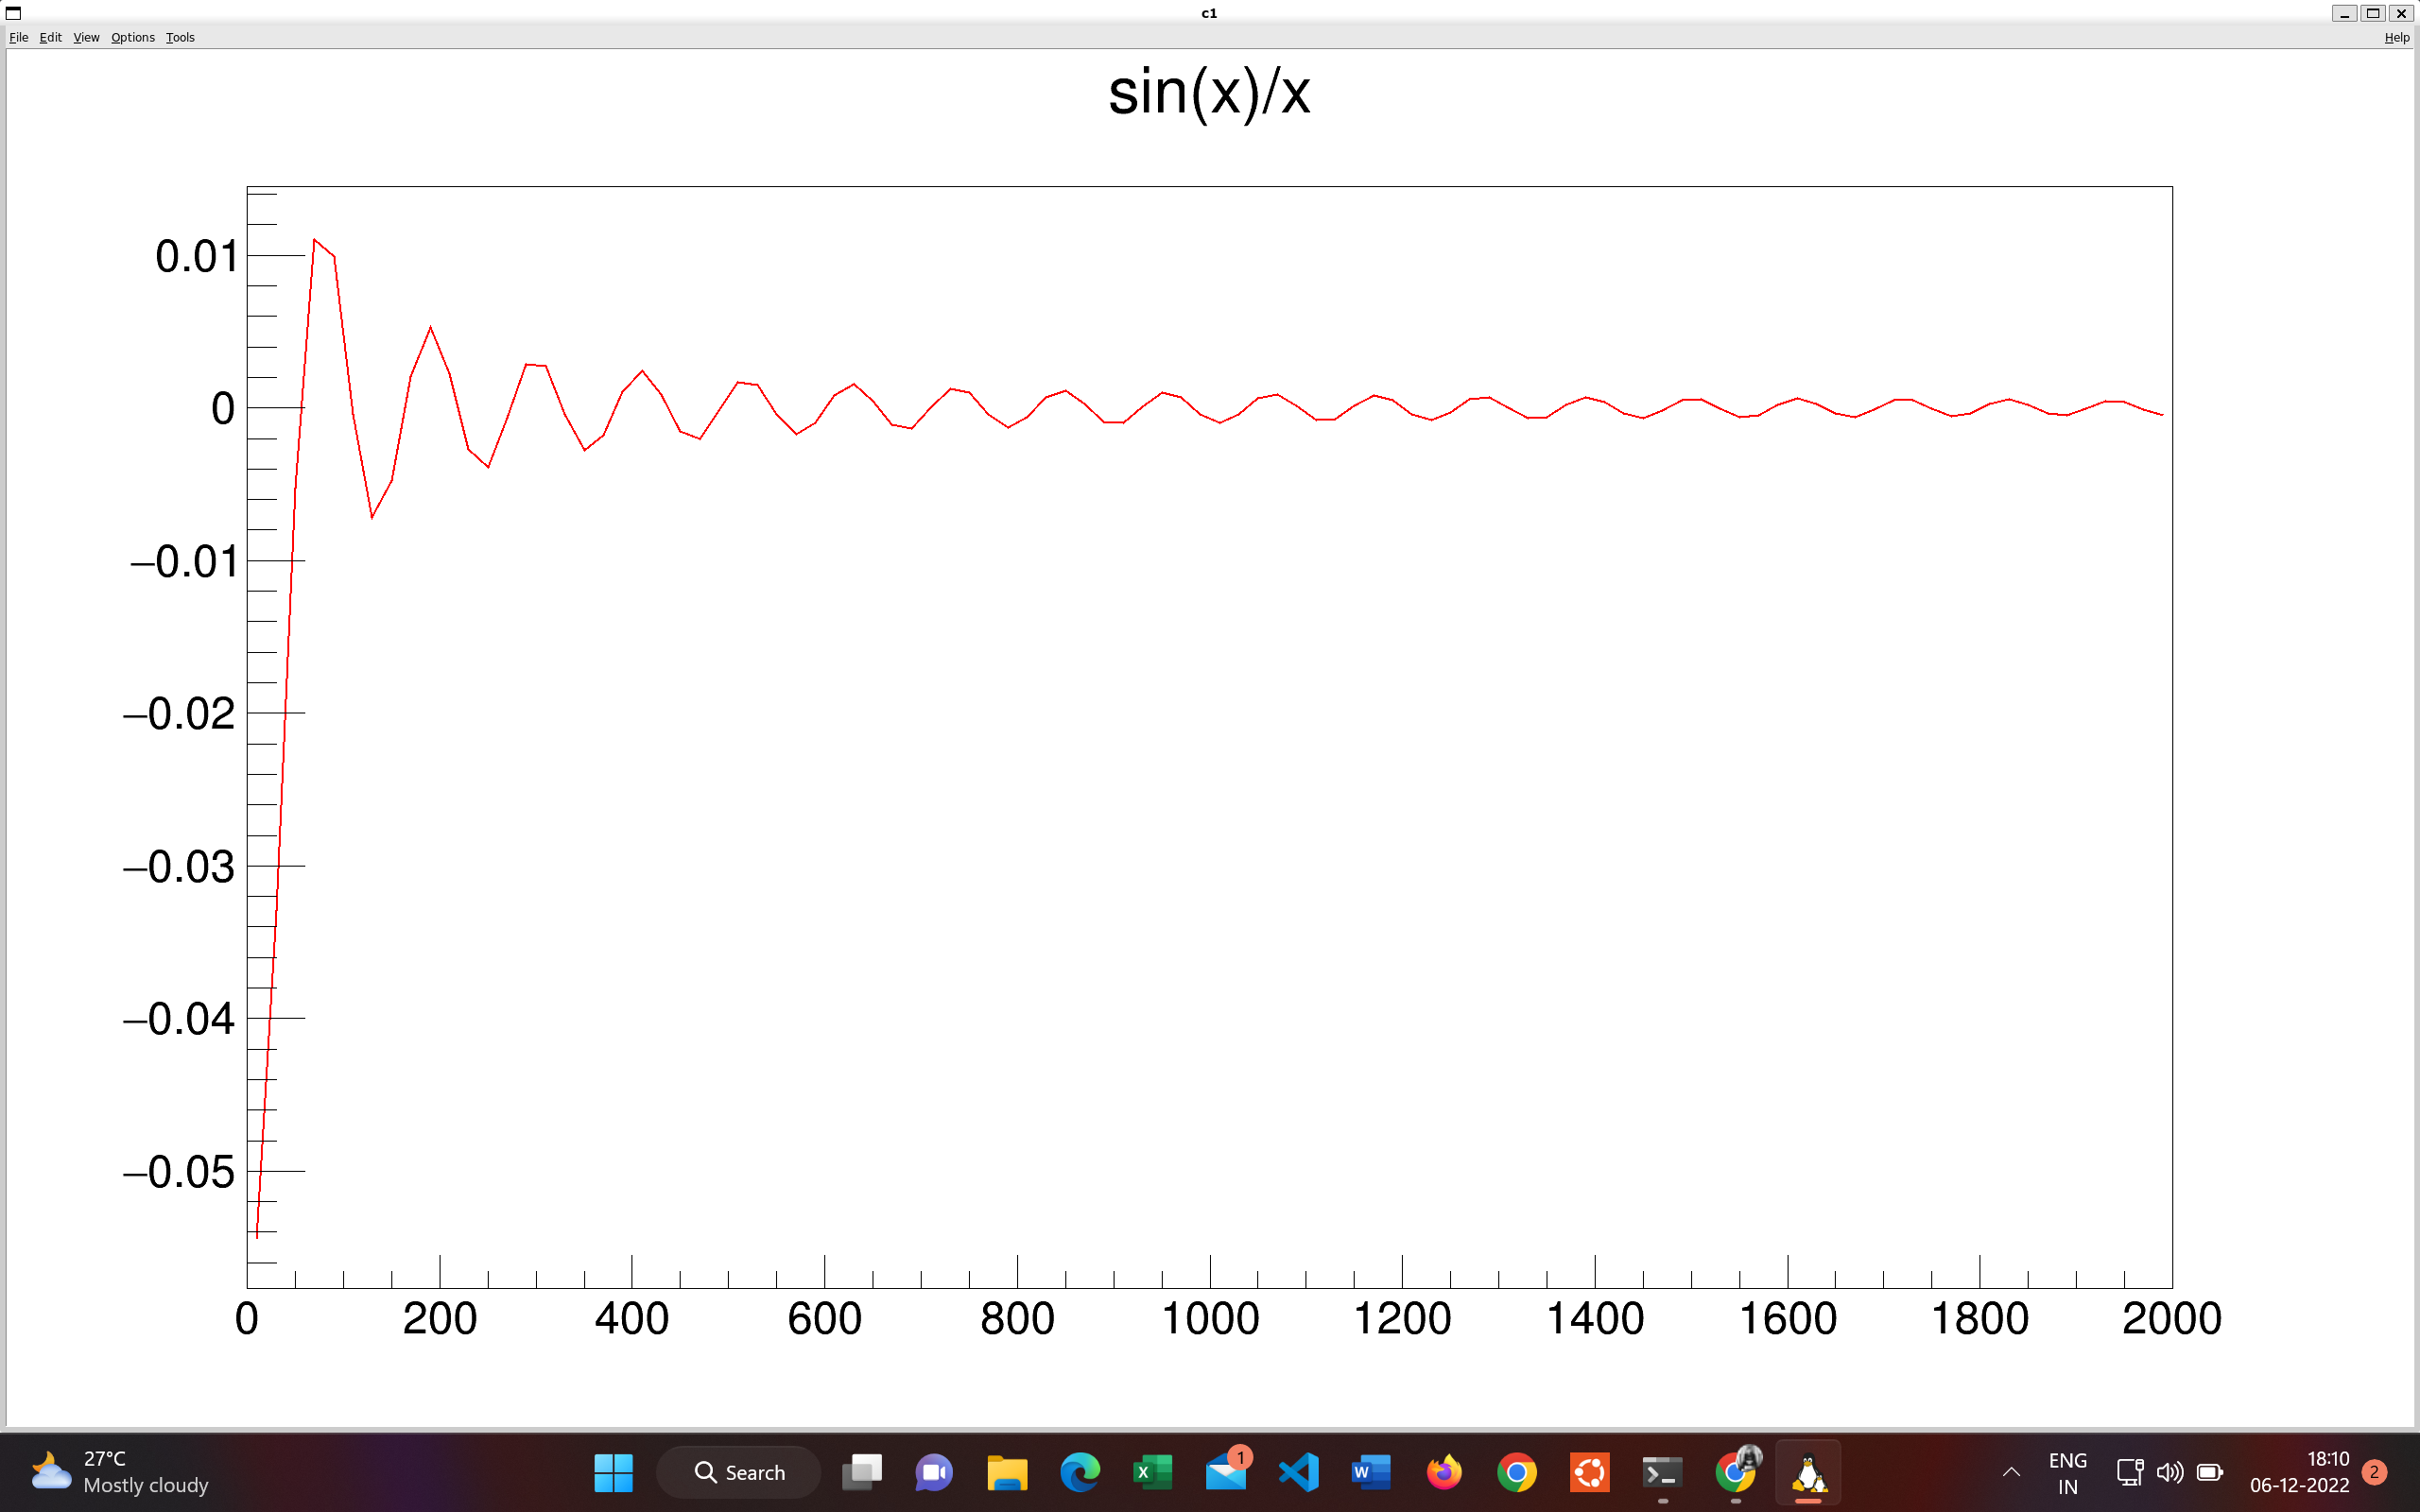
but when I plot it for large range it gives me some strange plot, also the value at x=0 is not 1 now
please explain .
TF1 f1(“f1”, “sin(x)/x”,-10,10);
f1.Draw();
for large range
TF1 f1(“f1”, “sin(x)/x”,0,2000);
f1.Draw();
sin(x)/x is not defined at x==0, but it tends to 1 in the limit in which x tends to 0.
In order to draw the plot, TF1 simply evaluates the function in a few points and then interpolates. With the larger range, the sampling is too coarse and close to x==0 you get a datapoint that corresponds e.g. to x == 1.5 or something like that.
Cheers,
Enrico
P.S.
in other words it’s just an artifact of the visualization done via sampling. If you evaluate the TF1 around x==0 you get the correct behavior, e.g.: