Root chi-squared completely messed up...?

Hi!

I’ve just stumbled on something quite weird.

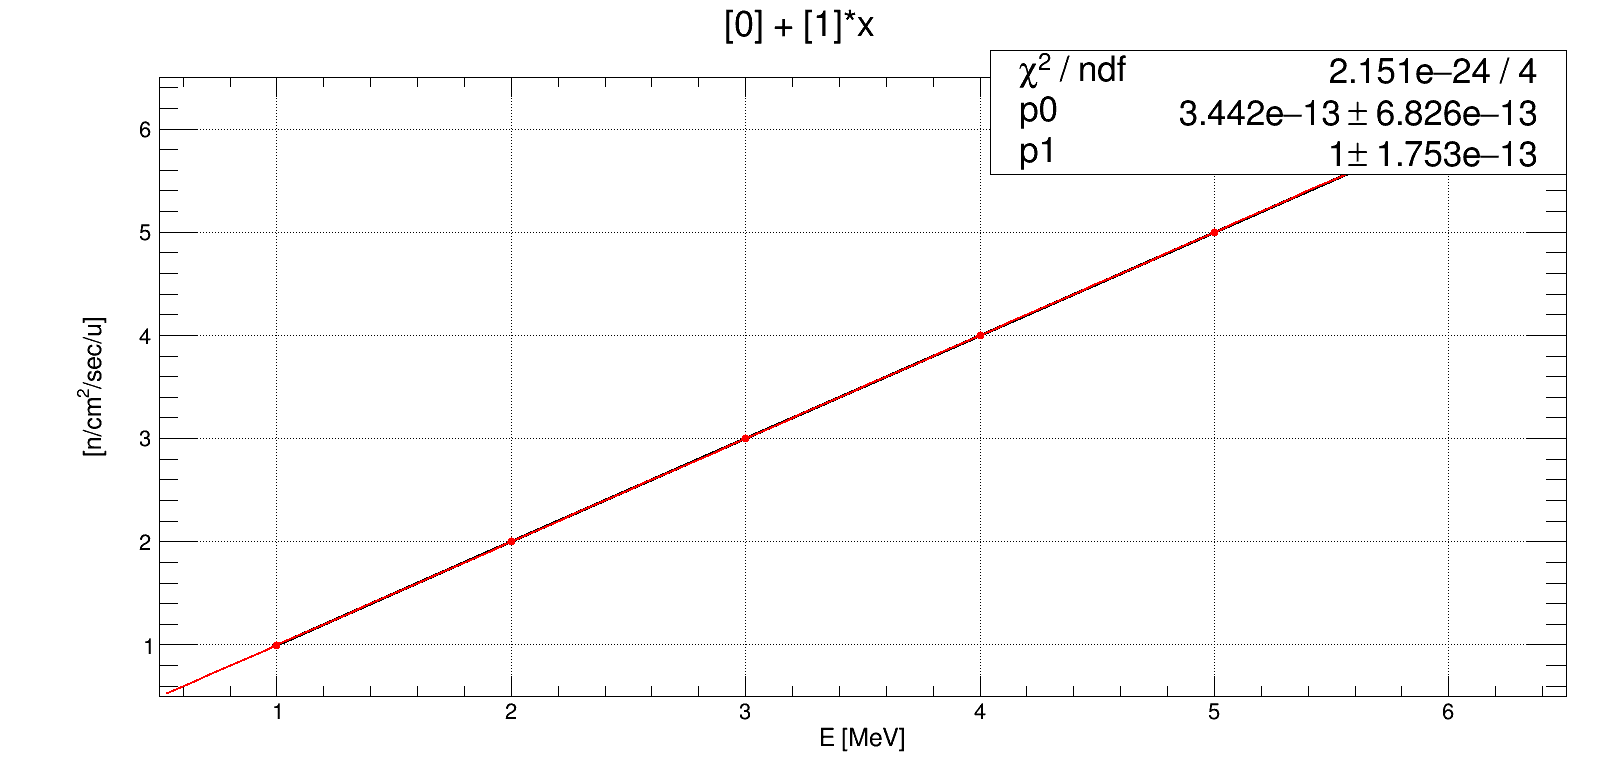
I tried to fit a few points on a line with a -well- a line.
More in detail: I draw a TGraph using 6 points (1,1), (2,2), (3,3), … (6,6). Then I fitted that using a TF1.

This is the result:

Why is the chi-squared so far from 1…?
It’s totally messed up. o.O

Hi,

You are having a perfect fit and you have not provide any error (uncertainty on the data points) so it is expected that your chi2 value is very close to zero.
Lorenzo

1 Like

Uhm…
That makes sense but… Well, I definitely need to study this chapter again, because I remember that the reduced chi^2 should be about 1 for “best” fits. Isn’t it?

How does ROOT calculate it?
Isn’t it just: https://s3-eu-west-1.amazonaws.com/tutor2u-media/subjects/geography/studynoteimages/chi-squared-equation.png?mtime=20151023210421
where the “observed frequencies” are the y-values of the points in the input file, while the “expected frequencies” are the y-values evaluated from the fit function at the same x coordinates?

If I do the same calculation, I get different results than those given by ROOT.

This topic was automatically closed 14 days after the last reply. New replies are no longer allowed.