Dear experts I am trying to plot the projection of an extended B and BBar datasets onto the deltat distribution, the projections work fine for individual pdfs but not for the extended pdf
frame = var.frame()
print("Plotting B0 tagged dataset...")
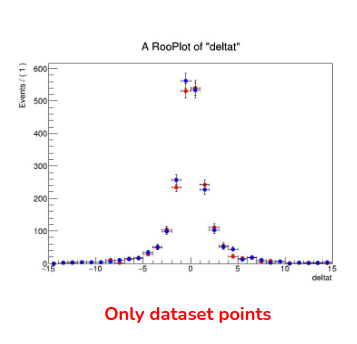
datasets[0].plotOn(frame, R.RooFit.Binning(nbins), R.RooFit.MarkerColor(R.kRed), R.RooFit.Name("data B0 tag"))
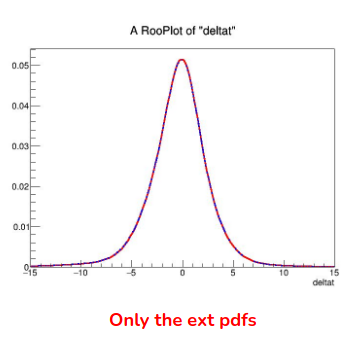
pdfs[0].plotOn(frame, R.RooFit.ProjWData(R.RooArgSet(*cond_vars), datasets[0]), R.RooFit.LineColor(R.kRed), R.RooFit.Name("pdf B0 tag"))
print("Plotting B0bar tagged dataset...")
datasets[1].plotOn(frame, R.RooFit.Binning(nbins), R.RooFit.MarkerColor(R.kBlue), R.RooFit.Name("data B0bar tag"))
pdfs[1].plotOn(frame, R.RooFit.ProjWData(R.RooArgSet(*cond_vars), datasets[1]), R.RooFit.LineColor(R.kBlue), R.RooFit.Name("pdf B0bar tag"))
this is ran as
    fu.plot_sc(
        pdfs=[ws.pdf("pdf_full_td_btag"), ws.pdf("pdf_full_td_bartag")],
        datasets=[data_set_td_btag, data_set_td_bartag],
        var=ws.var("deltat"),
        cond_vars=[ws.var("deltaterr"), ws.var("mod_mbc"), ws.var("deltae"), ws.var('r'), ws.var("csobdtprime")],
        nbins=30,
        plotpath=f"{plot_dir}/sc.png",

    )
pdf_full_td_btag/bartag = nsig*sig_pdf_{btag/bartag} + n_bbar*bbbar_pdf + ncont*cont_pdf
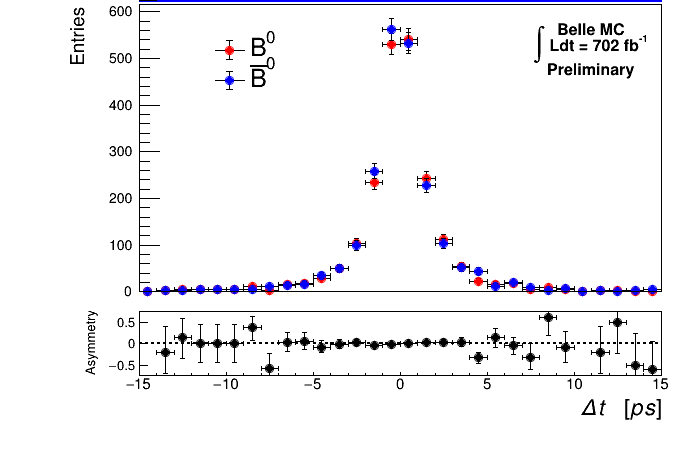
I am getting the following image as the result