I have successfully fitted a weighted sum of TH2D templates to my measured data and now need to determine the particle counts.
For this I would like to take slices of my combined pdf scaled to the data (brace your eyes for the abomination that is about to follow):
void plotProjection(RooAbsPdf& model,
                    RooDataHist& data,
                    RooRealVar& E,
                    RooRealVar& MM,
                    double lo, double hi,
                    const std::string& name = "proj")
{
    // Restrict data to E slice
    RooDataHist* dataSlice = (RooDataHist*) data.reduce(Cut(Form("E>%f && E<%f",lo,hi)));

    // Frame for MM
    RooPlot* frame = MM.frame(Bins(60),Title(Form("Projection %.2f < E < %.2f",lo,hi)));

    // --- Data with error bars
    dataSlice->plotOn(frame,DataError(RooAbsData::SumW2),DrawOption("e"),Name("data"));

    // --- Full model
    //RooAbsPdf* model_slice = (RooAbsPdf*) model.reduce(Cut(Form("E>%f && E<%f",lo,hi))); <- This function does not exist!!
    model.plotOn(frame,ProjectionRange(Form("E>%.2f && E<%.2f",lo,hi)), Name("model"));

    // --- Individual components (with Name tags)
    model.plotOn(frame,Components("ext_lambda1670"),LineStyle(kDashed),LineColor(kBlue),      Name("lambda1670"));
    model.plotOn(frame,Components("ext_lambda1405"),LineStyle(kDashed),LineColor(kRed),       Name("lambda1405"));
    model.plotOn(frame,Components("ext_lambda1520"),LineStyle(kDashed),LineColor(kGreen+2),   Name("lambda1520"));
    model.plotOn(frame,Components("ext_sigma1385"), LineStyle(kDashed),LineColor(kMagenta),   Name("sigma1385"));
    model.plotOn(frame,Components("ext_lambda0pi0"),LineStyle(kDashed),LineColor(kCyan+2),    Name("lambda0pi0"));
    model.plotOn(frame,Components("ext_lambda0eta"),LineStyle(kDashed),LineColor(kOrange+7),  Name("lambda0eta"));
    //model.plotOn(frame,Components("ext_s1670"),     LineStyle(kDashed),LineColor(kBlack),   Name("Sigma1670"));
    //model.plotOn(frame,Components("ext_l1690"),     LineStyle(kDashed),LineColor(kViolet),  Name("Lambda1690"));
    //model.plotOn(frame,Components("ext_s1660"),     LineStyle(kDashed),LineColor(kGray+2),  Name("Sigma1660"));

    // Draw
    TCanvas* c = new TCanvas(name.c_str(),name.c_str(),900,700);
    frame->Draw();

    // Legend
    TLegend* leg = new TLegend(0.65,0.45,0.88,0.88);  // adjust pos as needed
    leg->SetBorderSize(0);
    leg->SetFillStyle(0);
    leg->AddEntry(frame->findObject("data"), "Data", "lep");
    leg->AddEntry(frame->findObject("model"), "Total Fit", "l");
    leg->AddEntry(frame->findObject("lambda1670"), "Lambda(1670)", "l");
    leg->AddEntry(frame->findObject("lambda1405"), "Lambda(1405)", "l");
    leg->AddEntry(frame->findObject("lambda1520"), "Lambda(1520)", "l");
    leg->AddEntry(frame->findObject("sigma1385"),  "Sigma(1385)", "l");
    leg->AddEntry(frame->findObject("lambda0pi0"), "Lambda0 + pi0", "l");
    leg->Draw();

    c->Update();
}
I’m taking slices of the data, which works well, however trying to take the projection of a slice in the same interval does not work at all. On the left you can see a projection I made manually, on the right is the graph produced by the code above.
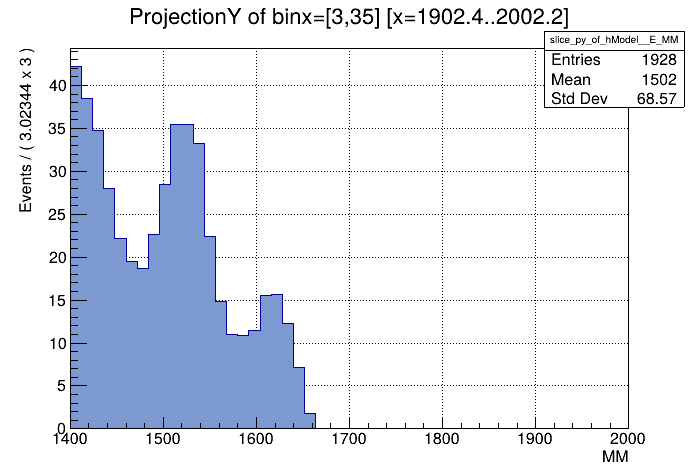
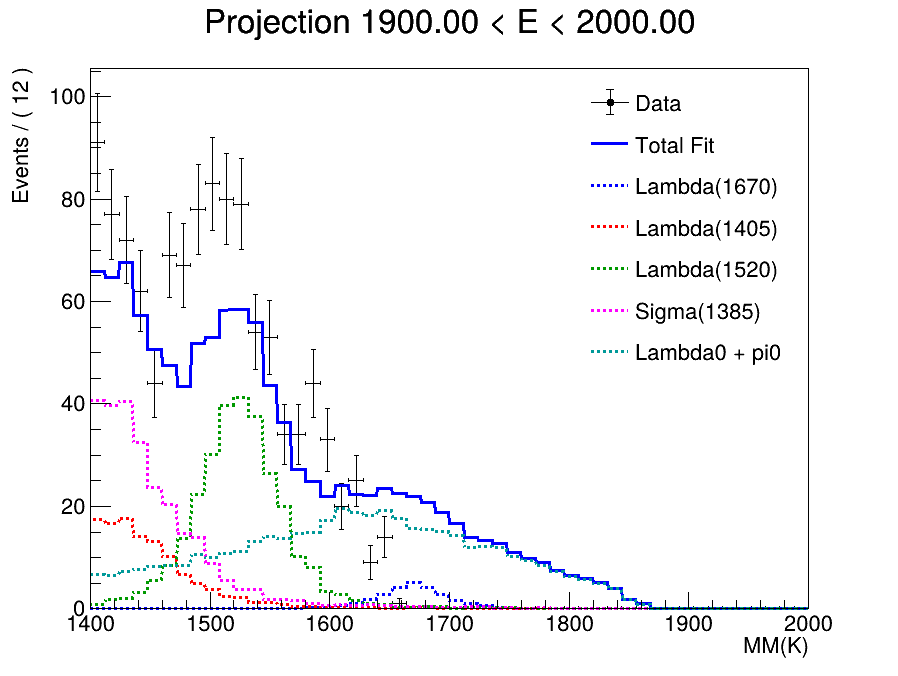
The projection I made manually fits the shape of the data reasonably well, the one on the right seems to integrate over the entire x-Axis.
My questions are as follows:
- How do I correctly take the projection slices of the fitted TH2F to compare against my data?
- How do I get the particle counts for each component for the corresponding section?
ROOT Version: 6.36.02
Platform: Linux
Compiler: GCC
Appendix
The fit function
RooFitResult* fit_channels(TH2D* signal, TH2D* lambda1670, TH2D* lambda1405, TH2D* lambda1520, TH2D* sigma1385, TH2D* lambda0pi0, TH2D* lambda0eta, bool print = false) {
//Constructs a ROOFIT model from backgroundchannels
//and performs a binned likelyhood fit.
//Define Variables
double Emin = signal->GetXaxis()->GetXmin();
//double Emax = signal->GetXaxis()->GetXmax();
double Emax = 2500.;
double MMmin = signal->GetYaxis()->GetXmin();
double MMmax = signal->GetYaxis()->GetXmax();
RooRealVar E("E","E", Emin, Emax);
RooRealVar MM("MM","MM(K)", MMmin, MMmax);
//import histograms into roofit
RooDataHist data("signal","signal", RooArgSet(E,MM), Import(*signal));
RooDataHist channel("lambda1670","Channel lambda1670", RooArgSet(E,MM), Import(*lambda1670));
RooDataHist bc1("lambda1405","Background Channel lambda1405", RooArgSet(E,MM), Import(*lambda1405));
RooDataHist bc2("lambda1520","Background Channel lambda1520", RooArgSet(E,MM), Import(*lambda1520));
RooDataHist bc3("sigma1385","Background Channel sigma1385", RooArgSet(E,MM), Import(*sigma1385));
RooDataHist bc4("lambda0pi0","Background Channel lambda0pi0", RooArgSet(E,MM), Import(*lambda0pi0));
RooDataHist bc5("lambda0eta","Background Channel lambda0eta", RooArgSet(E,MM), Import(*lambda0eta));
// Convert to RooHistPdfs
RooHistPdf pdf0("pdf_lambda1670","PDF lambda1405",RooArgSet(E,MM),channel);
RooHistPdf pdf1("pdf_lambda1405","PDF lambda1405",RooArgSet(E,MM),bc1);
RooHistPdf pdf2("pdf_lambda1520","PDF lambda1520",RooArgSet(E,MM),bc2);
RooHistPdf pdf3("pdf_sigma1385","PDF sigma1385",RooArgSet(E,MM),bc3);
RooHistPdf pdf4("pdf_lambda0pi0","PDF lambda0pi0",RooArgSet(E,MM),bc4);
RooHistPdf pdf5("pdf_lambda0eta","PDF lambda0eta",RooArgSet(E,MM),bc5);
// Yields (free parameters)
double Ntot = signal->Integral();
RooRealVar N0("N_lambda1670","Yield lambda1670",0.2*Ntot, 0,0.2*Ntot);
RooRealVar N1("N_lambda1405","Yield lambda1405",0.2*Ntot ,0,Ntot);
RooRealVar N2("N_lambda1520","Yield lambda1520",0.2*Ntot ,0,Ntot);
RooRealVar N3("N_sigma1385","Yield sigma1385", 0.2*Ntot ,0,Ntot);
RooRealVar N4("N_lambda0pi0","Yield lambda0pi0",0.2*Ntot ,0,Ntot);
RooRealVar N5("N_lambda0eta","Yield lambda0eta",0.2*Ntot ,0,Ntot);
// Extended PDFs
RooExtendPdf ext_l1670("ext_lambda1670","ext_lambda1670",pdf0,N0);
RooExtendPdf ext_l1405("ext_lambda1405","ext_lambda1405",pdf1,N1);
RooExtendPdf ext_l1520("ext_lambda1520","ext_lambda1520",pdf2,N2);
RooExtendPdf ext_s1385("ext_sigma1385","ext_sigma1385",pdf3,N3);
RooExtendPdf ext_l_pi("ext_lambda0pi0","ext_lambda0pi0",pdf4,N4);
RooExtendPdf ext5("ext_lambda0eta","ext_lambda0eta",pdf5,N5);
// --- Full model with 9 components
RooAddPdf model("model","Full model",
RooArgList(ext_l1670,ext_l1405,ext_l1520,ext_s1385,ext_l_pi)); //template
// --- Fit
RooFitResult* result = model.fitTo(data,Extended(kTRUE),Save(),PrintLevel(1));
if(print) result->Print("v");
//Show results: MOVE THIS CALL OUTSIDE THIS FUNCTION LATER
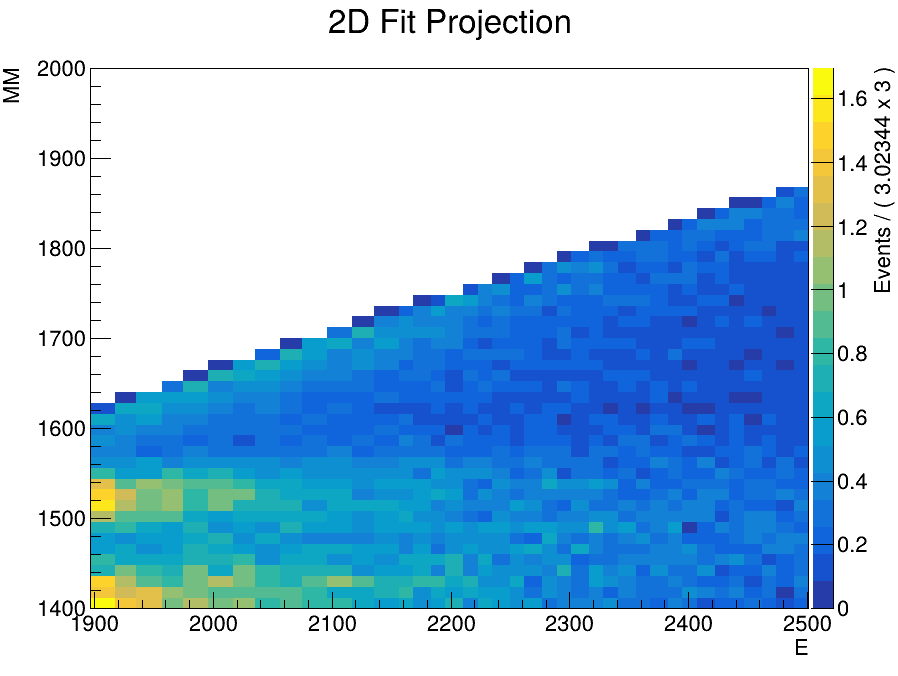
plot2DFit(model, E, MM, "fit2D", 200, 200);
plotProjection(model, data, E, MM, 1900, 2000, "proj_1900_200");
return result;
}
Minimal Reproducable Example
For display functions see above.
using namespace ROOT;
#include <TFile.h>
#include <TH1D.h>
#include <iostream>
#include <fmt/format.h>
using namespace RooFit;
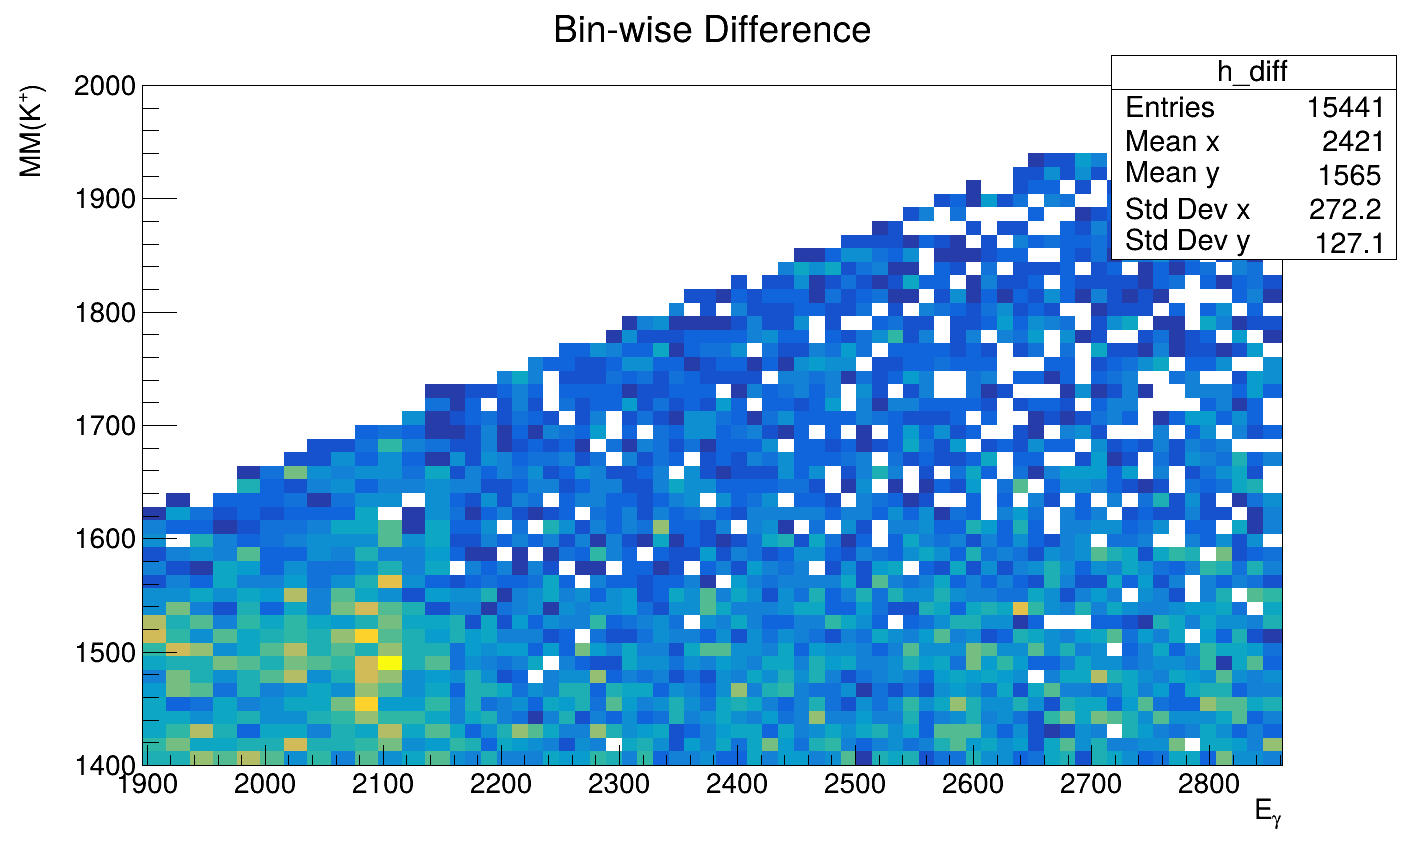
TH2D* read_th2d(TFile* file, const char* histname = "h_diff", int rebin = 1) {
if (!file || file->IsZombie()) {
std::cerr << "Error: invalid or zombie file\n";
return nullptr;
}
TH2D* count_hist = (TH2D*)file -> Get(histname);
if (!count_hist) {
std::cerr << "Error: histogram '" << histname << "' not found in file\n";
return nullptr;
}
if (rebin > 1) {
count_hist -> RebinY(rebin);
}
return count_hist;
}
void main() {
int rebiny = 4;
//Do some other important stuff here, which is working
//Get Count
TFile *f_signal = TFile::Open("./results/raw_signal/data.root");
TH2D* signal = read_th2d(f_signal, "h_diff", rebiny);
//Get Background Channels
//TCanvas *channel_test = new TCanvas();
TFile* background_channels = TFile::Open("results/background/simulated_background_channels.root");
TH2D* lambda1405 = read_th2d(background_channels, "lambda1405", rebiny);
TH2D* lambda1520 = read_th2d(background_channels, "lambda1520", rebiny);
TH2D* sigma1385 = read_th2d(background_channels, "sigma1385", rebiny);
TH2D* lambda0pi0 = read_th2d(background_channels, "lambdapi", rebiny);
TH2D* lambda0eta = read_th2d(background_channels, "lambdaeta", rebiny);
TFile* f_lambda1670 = TFile::Open("results/export/lambda1670_simulation.root");
TH2D* lambda1670 = read_th2d(f_lambda1670, "h_MM_K_Beam", rebiny);
TCanvas *fit_results = new TCanvas();
fit_channels(signal, lambda1670, lambda1405, lambda1520, sigma1385, lambda0pi0, lambda0eta, true);
f_data -> Close();
f_signal -> Close();
f1 -> Close();
background_channels -> Close();
}
data.root (17.5 KB)
lambda1670_simulation.root (14.1 KB)
simulated_background_channels.root (45.0 KB)
Edit
Don’t you love, when you spend an hour typing up a well formulated question just to find a partial solution within minutes after posting it?
This console output is a lie:
INFO:Plotting -- RooAbsReal::plotOn(model) plot on MM integrates over variables (E) in range E>1900.00 && E<2000.00
ProjectionRange expects the name of a previously defined Range:
E.setRange("sliceRange", lo, hi);
model.plotOn(frame, ProjectionRange("sliceRange"), Name("model"));
The shape looks right but I now need to scale the function correctly. I have tried the following:
model.plotOn(frame, ProjectionRange("sliceRange"), Normalization(RooAbsReal::RelativeExpected), Name("model"));
but that is still consistently lower than the data in all slices.