Dear experts,
Does it exists in RooFit a trick which allows to show negative components in a valid RooAddPdf when
model.plotOn( frame, Components("negcomp")
is used ?
See attached script and results
import ROOT as r
x = r.RooRealVar('x', 'x', 0, -10, 10)
mean1 = r.RooRealVar('mean1', 'mean1', 4, -5, 5)
mean2 = r.RooRealVar('mean2', 'mean2', -4, -5, 5)
mean3 = r.RooRealVar('mean3', 'mean3', 0, 0, 10)
sigma1 = r.RooRealVar('sigma1', 'sigma1', 2, 0.1, 5)
sigma2 = r.RooRealVar('sigma2', 'sigma2', 2, 0.1, 5)
sigma3 = r.RooRealVar('sigma3', 'sigma3', 1, 0.5, 5)
gaus1 = r.RooGaussian('gaus1', 'gaus1', x, mean1, sigma1)
gaus2 = r.RooGaussian('gaus2', 'gaus2', x, mean2, sigma2)
gaus3 = r.RooGaussian('gaus3', 'gaus3', x, mean3, sigma3)
gaus4 = r.RooGaussian('gaus4', 'gaus4', x, mean3, sigma3)
yield1 = r.RooRealVar('frac1', 'frac1', 0.5, -1,1)
yield2 = r.RooRealVar('frac2', 'frac2', 0.5, -1,1)
yield3 = r.RooRealVar('frac3', 'frac3', -0.2, -1,1)
yield4 = r.RooRealVar('frac4', 'frac4', 0.2, -1,1)
pdf = r.RooAddPdf('sum', 'sum', r.RooArgList(gaus1, gaus2, gaus3, gaus4), r.RooArgList(yield1, yield2,yield3, yield4))
cc = r.TCanvas()
frame = x.frame()
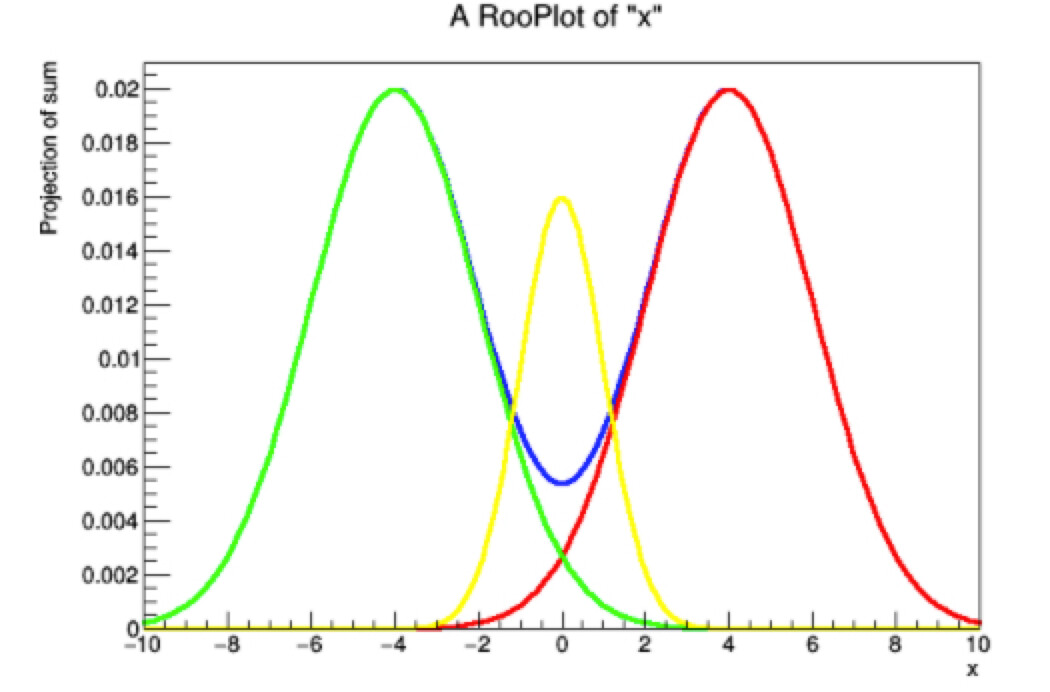
pdf.plotOn(frame)
pdf.plotOn( frame,r.RooFit.Components("gaus1"), r.RooFit.LineColor(r.kRed))
pdf.plotOn( frame,r.RooFit.Components("gaus2"), r.RooFit.LineColor(r.kGreen))
pdf.plotOn( frame,r.RooFit.Components("gaus4"), r.RooFit.LineColor(r.kYellow))
pdf.plotOn( frame,r.RooFit.Components("gaus3"), r.RooFit.LineColor(r.kCyan))
frame.Draw()
cc.Draw()
Thanks
Renato
It sees to me that the plotON for the full model works as expected for pdfs, having negative components, but the expected entries in each x-values being still positive defined, however, when Components is used it doesn’t allow to draw the negative one.
Of course one can patch things to grab rooCurves, and draw negative entries, but i wonder if there are special options one can use for those cases.