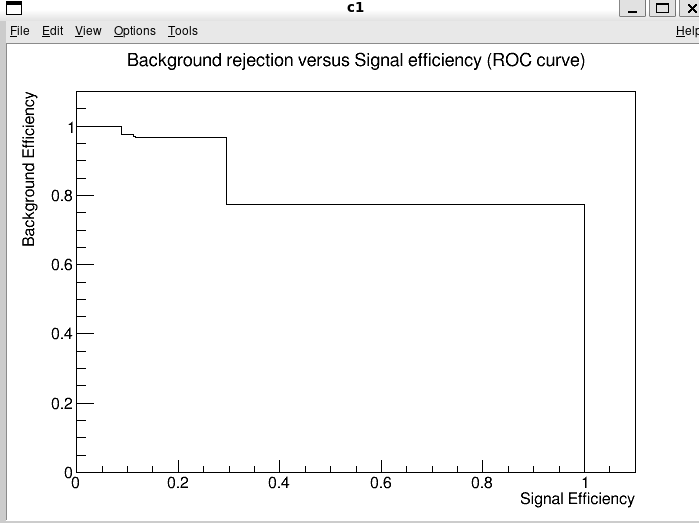
Hello. I am having trouble creating my ROC curve. Could someone please point me to the correct way? When I draw the histograms for signal and bkg, things look ok, but the ROC curve is quite strange.
void MyreaderROC() {

    TMVA::Tools::Instance();
    TString methodName = "BDT";

    auto inputFile = TFile::Open("/eos/user/j/jiyoo/jan19_makePuppitreeNewDS/training_trees_pt10To100_puppi_94X.root");

    inputFile->ls();
    auto sig_tree = (TTree*) inputFile->Get("Eta2p5To2p75_Prompt");
    auto bkg_tree = (TTree*) inputFile->Get("Eta2p5To2p75_Pileup");

    float nvtx,beta,dR2Mean,frac01,frac02,frac03,frac04,majW,minW,jetR,jetRchg,nParticles,nCharged,ptD,pull,jetPt,jetEta;

    TMVA::Reader* reader = new TMVA::Reader("!Color");

    reader->AddVariable("nvtx", &nvtx);
    reader->AddVariable("beta", &beta);
    reader->AddVariable("dR2Mean", &dR2Mean);
    reader->AddVariable("frac01", &frac01);
    reader->AddVariable("frac02", &frac02);
    reader->AddVariable("frac03", &frac03);
    reader->AddVariable("frac04", &frac04);
    reader->AddVariable("majW", &majW);
    reader->AddVariable("minW", &minW);
    reader->AddVariable("jetR", &jetR);
    reader->AddVariable("jetRchg", &jetRchg);
    reader->AddVariable("nParticles", &nParticles);
    reader->AddVariable("nCharged", &nCharged);
    reader->AddVariable("ptD", &ptD);
    reader->AddVariable("pull", &pull);
    //reader->AddSpectator("jetPt", &jetPt);
   // reader->AddSpectator("jetEta", &jetEta);

//    TString weightfile = "/eos/user/j/jiyoo/chs2/output/BDT_chs_94X/weights/pileupJetId_94X_Eta2p5To2p75_chs_BDT.weights.xml";
TString weightfile = "/eos/user/j/jiyoo/jan21_trainpuppiNS/eta2/output/BDT_chs_94X/weights/pileupJetId_94X_Eta2p5To2p75_puppi_BDT.weights.xml";

    reader->BookMVA( methodName, weightfile );

    auto h1 = new TH1D("h1","Classifier Output on Background Events",500,-1,1);
    auto h2 = new TH1D("h2","Classifier Output on Signal Events",500,-1,1);

    std::vector<float> vout;
    std::vector<float> vout2;

    auto readEvents = [&](TTree & tree, TH1 & histo) {
        tree.SetBranchAddress("nvtx", &nvtx);
        tree.SetBranchAddress("beta", &beta);
        tree.SetBranchAddress("dR2Mean", &dR2Mean);
        tree.SetBranchAddress("frac01", &frac01);
        tree.SetBranchAddress("frac02", &frac02);
        tree.SetBranchAddress("frac03", &frac03);
        tree.SetBranchAddress("frac04", &frac04);
        tree.SetBranchAddress("majW", &majW);
        tree.SetBranchAddress("minW", &minW);
        tree.SetBranchAddress("jetR", &jetR);
        tree.SetBranchAddress("jetRchg", &jetRchg);
        tree.SetBranchAddress("nParticles", &nParticles);
        tree.SetBranchAddress("nCharged", &nCharged);
        tree.SetBranchAddress("ptD", &ptD);
        tree.SetBranchAddress("pull", &pull);
        tree.SetBranchAddress("jetPt", &jetPt);
        tree.SetBranchAddress("jetEta", &jetEta);
        vout.clear();
        vout.resize(tree.GetEntries());
        //for (Long64_t ievt=0; ievt < tree.GetEntries();ievt++) {
        for (Long64_t ievt=0; ievt < 1000;ievt++) {
            if (ievt%500 == 0) std::cout << "--- ... Processing event: " << ievt << std::endl;
                tree.GetEntry(ievt);
                auto output = reader->EvaluateMVA(methodName);
                //if ( jetPt < 20 && jetPt > 10) {
                    histo.Fill(output);
                    //vout.push_back(output);
                    vout[ievt] = output;
               // }
        };
    };

    readEvents(*sig_tree,*h2);
    std::vector<float> sig_result = vout;

    readEvents(*bkg_tree,*h1);
    std::vector<float> bkg_result = vout;

    TMVA::ROCCurve * roc = new TMVA::ROCCurve(sig_result, bkg_result);
    TCanvas *c1 = new TCanvas("c1", "c1");
    TGraph *g = roc->GetROCCurve();
    g->Draw("AL");
    g->SetTitle("Background rejection versus Signal efficiency (ROC curve)");
    g->GetXaxis()->SetTitle("Signal Efficiency");
    g->GetYaxis()->SetTitle("Background Efficiency");
    gPad->Modified(); gPad->Update();
    c1->SaveAs("ROC2p5_2p75.png");

    std::unique_ptr<TFile> myFile2( TFile::Open("file_PT1020.root", "RECREATE") );
    myFile2->WriteObject(g, "g");

};