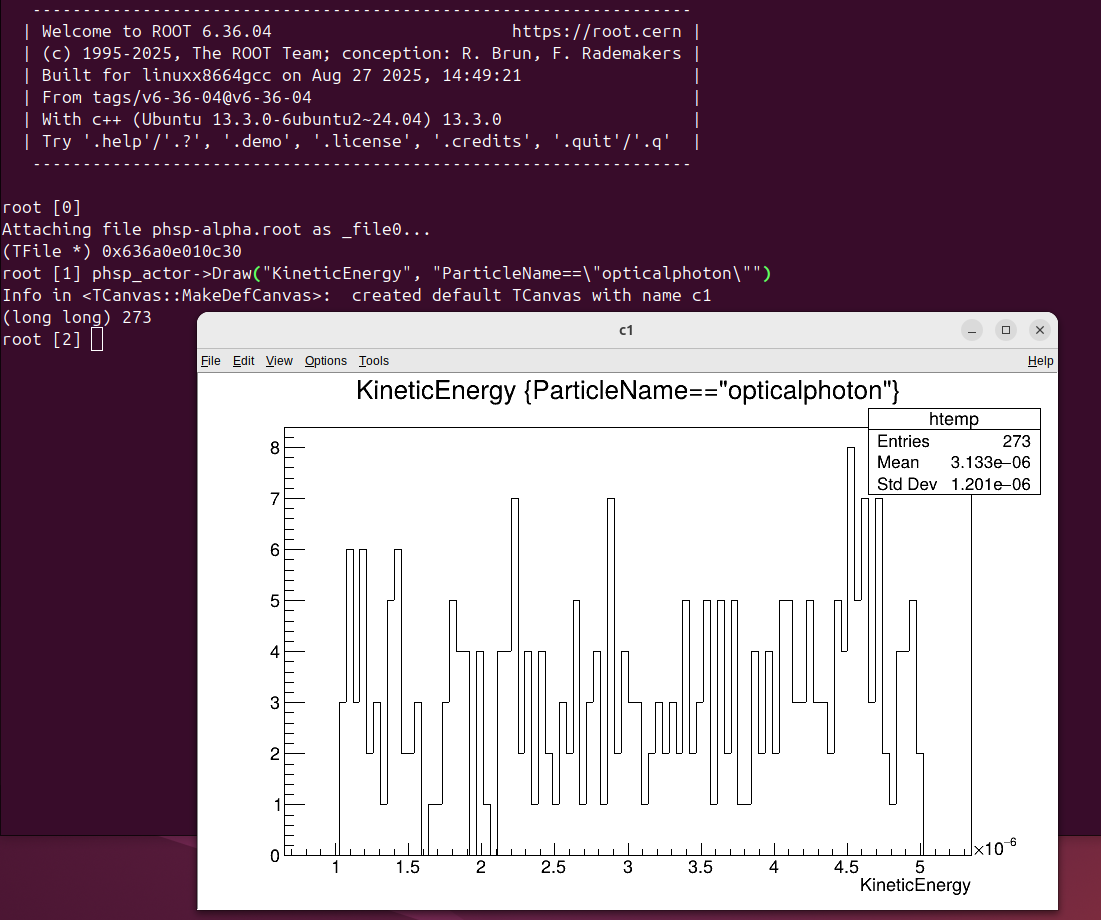
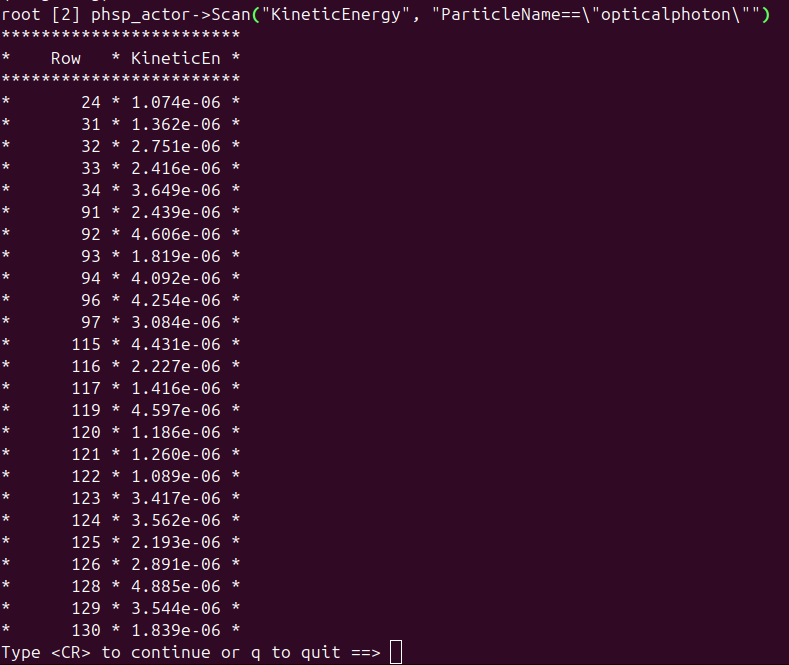
Scan gives you all the individual entries, not binned, while TTree::Draw (the first thing you did) uses a temporary histogram with 100 bins by default; you can retrieve it with the name htemp as long as you don’t close the canvas where it is drawn, and you can export it to a text file with SaveAs, e.g.
$ root hsimple.root
   ------------------------------------------------------------------
  | Welcome to ROOT 6.36.04                        https://root.cern |
  | (c) 1995-2025, The ROOT Team; conception: R. Brun, F. Rademakers |
  | Built for linuxx8664gcc on Aug 25 2025, 09:43:16                 |
  | From tags/v6-36-04@v6-36-04                                      |
  | With c++ (Ubuntu 13.3.0-6ubuntu2~24.04) 13.3.0                   |
  | Try '.help'/'.?', '.demo', '.license', '.credits', '.quit'/'.q'  |
   ------------------------------------------------------------------

root [0]
Attaching file hsimple.root as _file0...
(TFile *) 0x593b3681bb00
root [1] ntuple->Draw("px")
Info in <TCanvas::MakeDefCanvas>:  created default TCanvas with name c1
root [2] htemp->SaveAs("myhisto_px.csv")
Info in <TH1F::SaveAs>: csv file: myhisto_px.csv has been generated
root [3] .q
$  head myhisto_px.csv
-4.902,-4.8,0,
-4.8,-4.698,0,
-4.698,-4.596,0,
-4.596,-4.494,0,
-4.494,-4.392,0,
-4.392,-4.29,0,
-4.29,-4.188,0,
-4.188,-4.086,0,
-4.086,-3.984,1,
-3.984,-3.882,1,
$
(read the Documentation I linked to see what is being saved). You could also loop over the bins and get the bin centres or lower bin edges, and the bin contents (look for GetBinCenter, GetBinLowEdge, and GetBinContent on the same page above).
Note that the entries in your TTree are most probably not “binned” in the tree itself, so the bin contents from TTree::Draw may or may not be what you want, you may want to define and fill your own histogram (check out the same Doc…).