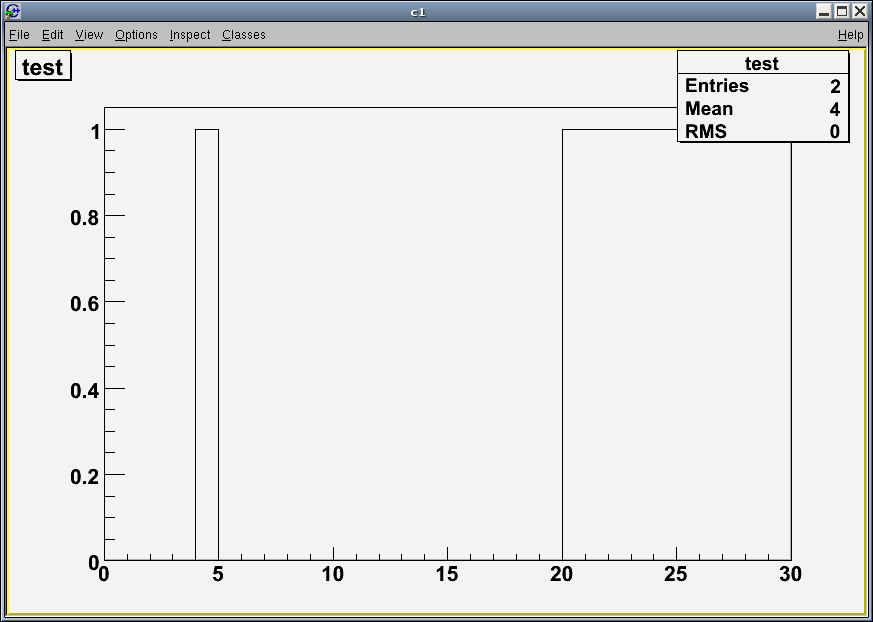
[28] I create an histo with 20 bins and between 0 and 20
[31] Here I fill with a value which is outside the bounds. However, in the upper right legend it is written : Entries 2; Mean 4. This is not consistent, one of those two values is wrong.
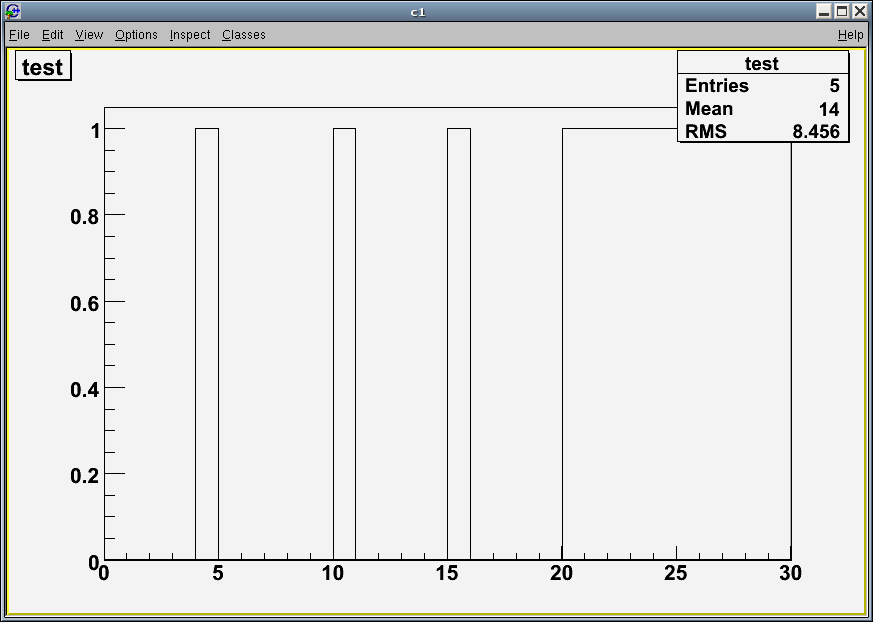
[32] Change the axis to 30 bins between 0 and 30. The legend is still wrong. I have a strange bar appearing between 20 and 30. See the first snapshot.
[33] I try to rebin the axis, thinking that could help -> still the same
[34-36] I add a few points, the legend is still not consistent, and the data above 20 are not appearing.
I don’t understand what I did wrong and if this legend’s problem is “normal”.
Moreover, does some kind of auto-scaling histogram exist ? an histo able to automatically change the axes if data out of bounds are added ?
Our problem is that we have a histogram but we don’t know what data we will have to put in it. As a consequence we create it with a default X axis range and ask the user to manually change it to whatever is relevant for the displayed data.
However this is not really smart and I was wondering if there is any way to change the range of the axis, either automatically (the histogram is aware that the biggest value is x and adapt the axis accordingly) or manually (it is what I tried in the example that I put in the previous message, with behaviours which seem to be bugs ? ).
The scale method is not relevant in our case, because the data should stay as they are, it is the axis range which should change.
Why don’t you use the histogramming automatic binning??
TH1F *h = new TH1F(“h”,“test”,100,0,0); //upper limit ,+ lower limit
h->Fill(some variable); //your loop filling the histo
Thanks for your reply. I tried the automatic binning and it works for the first value, but not for the next ones. Here is an example :
root [0] h = new TH1F("h","test",100,0,0);
root [1] h->Fill(5)
(Int_t)(-2)
root [2] c = new TCanvas
(class TCanvas*)0x93bc158
root [3] h->Draw()
root [4] h->Fill(10)
(Int_t)(-2)
The second value (10) is not displayed because the range of the axis goes from ~4 to ~6. I would like it to (automatically?) change it in order to display all the values. How can I do that ?
Moreover, I am still uncomfortable with the fact that the legend says : Entries 2, Mean 5. For me, this is wrong. As we put the values 5 and 10 (not displayed) we should have either 1 entry and Mean 5 or 2 entries and mean 7.5.
The automatic rebinning algorithm is reset once you make an operation on your histogram, including drawing the histogram. You can activate the algorithm (after Draw) again by calling:
h->SetBit(TH1::kCanRebin);
[quote]Moreover, I am still uncomfortable with the fact that the legend says : Entries 2, Mean 5. For me, this is wrong. As we put the values 5 and 10 (not displayed) we should have either 1 entry and Mean 5 or 2 entries and mean 7.5.
[/quote]Underflows/overflows are not counted (by default) when computing the mean/rms.
see TH1::StatOverflows