Dear root-team,
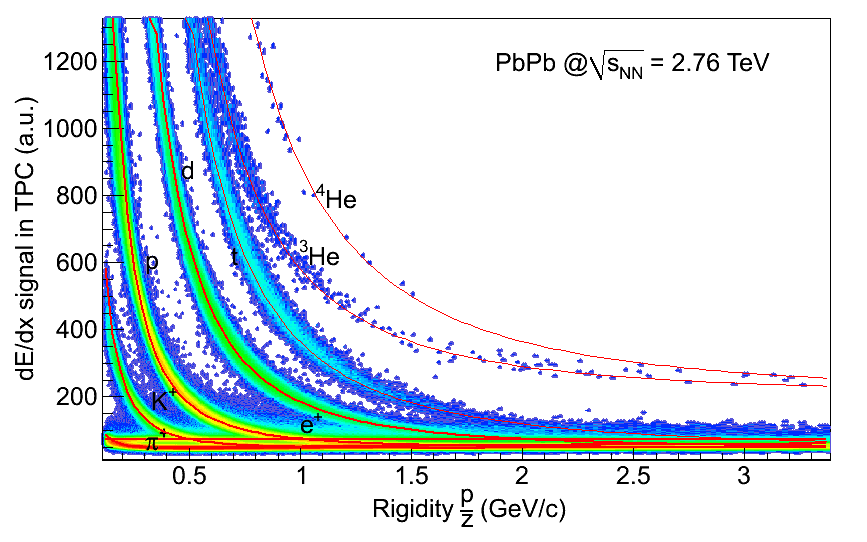
I am permanently plotting two dimensional histograms like the attached one for the ALICE experiment. In ROOT, there are in principle two options how to plot these kind of histograms:
a) a scatter plot which makes n dots (or markers) in a bin with n entries
b) “colz” which colors the entire bin according to the number of entries
In order to make much nicer plots, I would need the following:
A scatter plot which makes n markers in a bin with n entries, and the markers are in addition colored according to the number of entries.
Thanks a lot for your help, Alexander