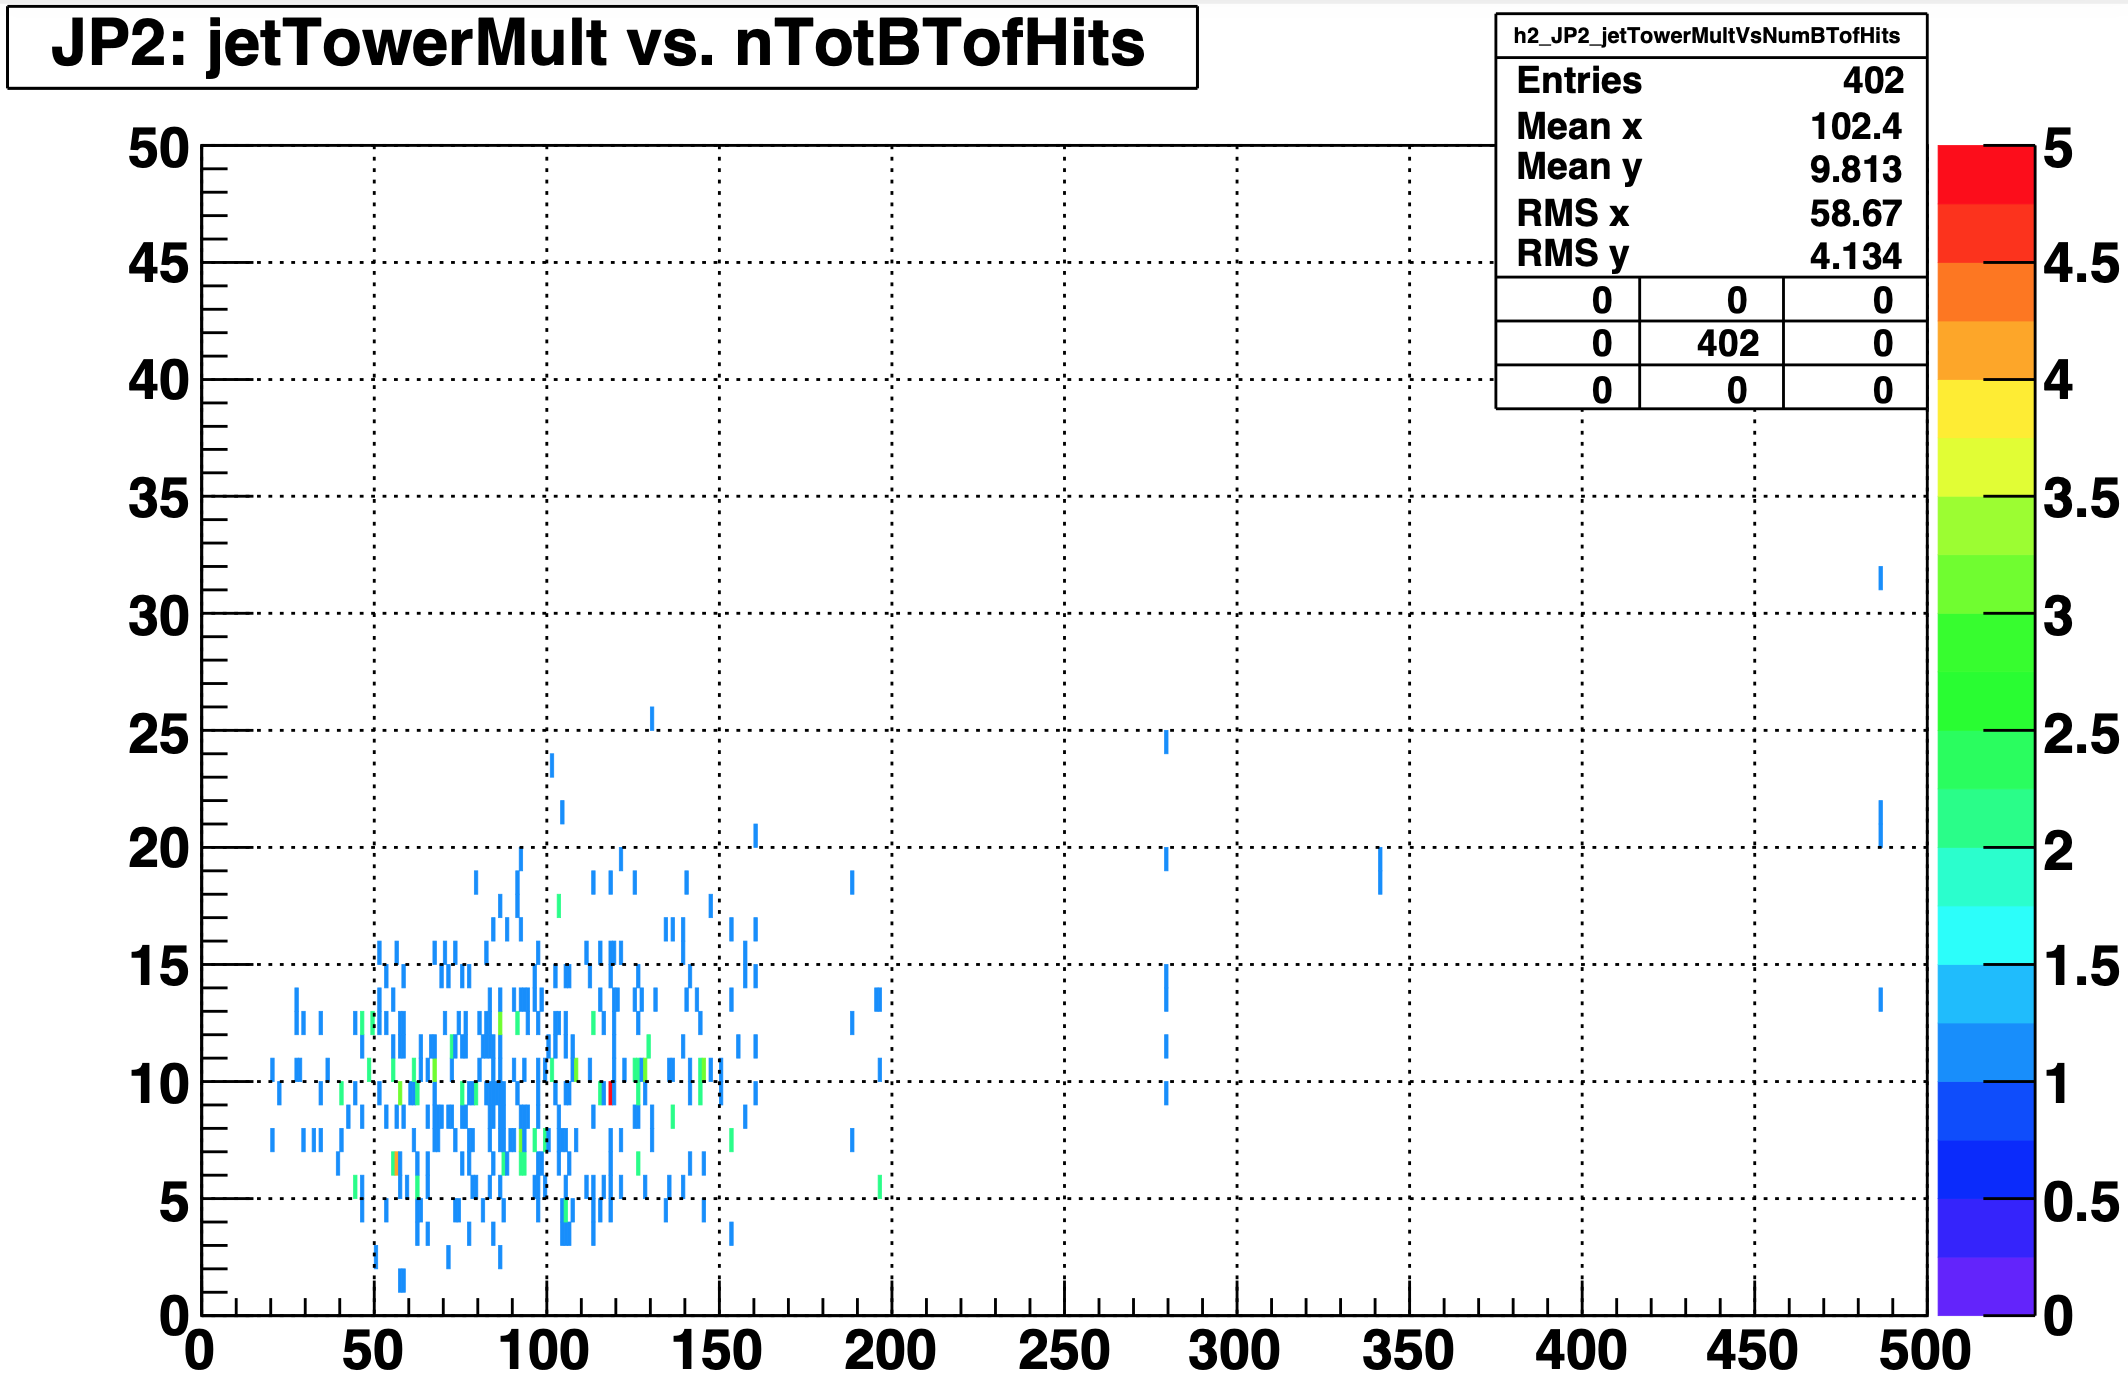
I was wondering if there is a way to get rid of the time stamp that shows up by default when generating a root plot? Please, see the attached example plot below. I am referring to the “Mon Nov 8 11:54:25 2021” portion of the plot, and if there is a command I can include in my plotting macro that will turn off the feature of showing a time stamp. Thank you very much!
When I look at my plotting macro, which is a modified version of a template I found online, I do not see an explicit place where the plotting macro executes a command to show the timestamp. Any thoughts on this? Please, see my attached plotting macro below.
I added those test statements and here is the output. It doesn’t seem like anything is stored in the axis titles.
root4star -l -b -q scatterPlots_tofQA.C
root4star [0]
Processing scatterPlots_tofQA.C...
Info in <TCanvas::Print>: pdf file scatterPlots_tofQA.pdf has been created
h2_JP2_numGTrkBTofHitsVsNumBTofHits


Info in <TCanvas::Print>: Current canvas added to pdf file scatterPlots_tofQA.pdf
h2_BBCMB_numGTrkBTofHitsVsNumBTofHits


Info in <TCanvas::Print>: Current canvas added to pdf file scatterPlots_tofQA.pdf
h2_JP2_numPTrkBTofHitsVsNumBTofHits


Info in <TCanvas::Print>: Current canvas added to pdf file scatterPlots_tofQA.pdf
h2_BBCMB_numPTrkBTofHitsVsNumBTofHits


Info in <TCanvas::Print>: Current canvas added to pdf file scatterPlots_tofQA.pdf
h2_JP2_jetPtVsNumBTofHits


Info in <TCanvas::Print>: Current canvas added to pdf file scatterPlots_tofQA.pdf
h2_BBCMB_jetPtVsNumBTofHits


Info in <TCanvas::Print>: Current canvas added to pdf file scatterPlots_tofQA.pdf
h2_JP2_jetEtaVsNumBTofHits


Info in <TCanvas::Print>: Current canvas added to pdf file scatterPlots_tofQA.pdf
h2_BBCMB_jetEtaVsNumBTofHits


Info in <TCanvas::Print>: Current canvas added to pdf file scatterPlots_tofQA.pdf
h2_JP2_jetPhiVsNumBTofHits


Info in <TCanvas::Print>: Current canvas added to pdf file scatterPlots_tofQA.pdf
h2_BBCMB_jetPhiVsNumBTofHits


Info in <TCanvas::Print>: Current canvas added to pdf file scatterPlots_tofQA.pdf
h2_JP2_jetRtVsNumBTofHits


Info in <TCanvas::Print>: Current canvas added to pdf file scatterPlots_tofQA.pdf
h2_BBCMB_jetRtVsNumBTofHits


Info in <TCanvas::Print>: Current canvas added to pdf file scatterPlots_tofQA.pdf
h2_JP2_jetTrackMultVsNumBTofHits


Info in <TCanvas::Print>: Current canvas added to pdf file scatterPlots_tofQA.pdf
h2_BBCMB_jetTrackMultVsNumBTofHits


Info in <TCanvas::Print>: Current canvas added to pdf file scatterPlots_tofQA.pdf
h2_JP2_jetTowerMultVsNumBTofHits


Info in <TCanvas::Print>: Current canvas added to pdf file scatterPlots_tofQA.pdf
h2_BBCMB_jetTowerMultVsNumBTofHits


Info in <TCanvas::Print>: Current canvas added to pdf file scatterPlots_tofQA.pdf
Info in <TCanvas::Print>: Current canvas added to pdf file scatterPlots_tofQA.pdf

This is the end of ROOT -- Goodbye
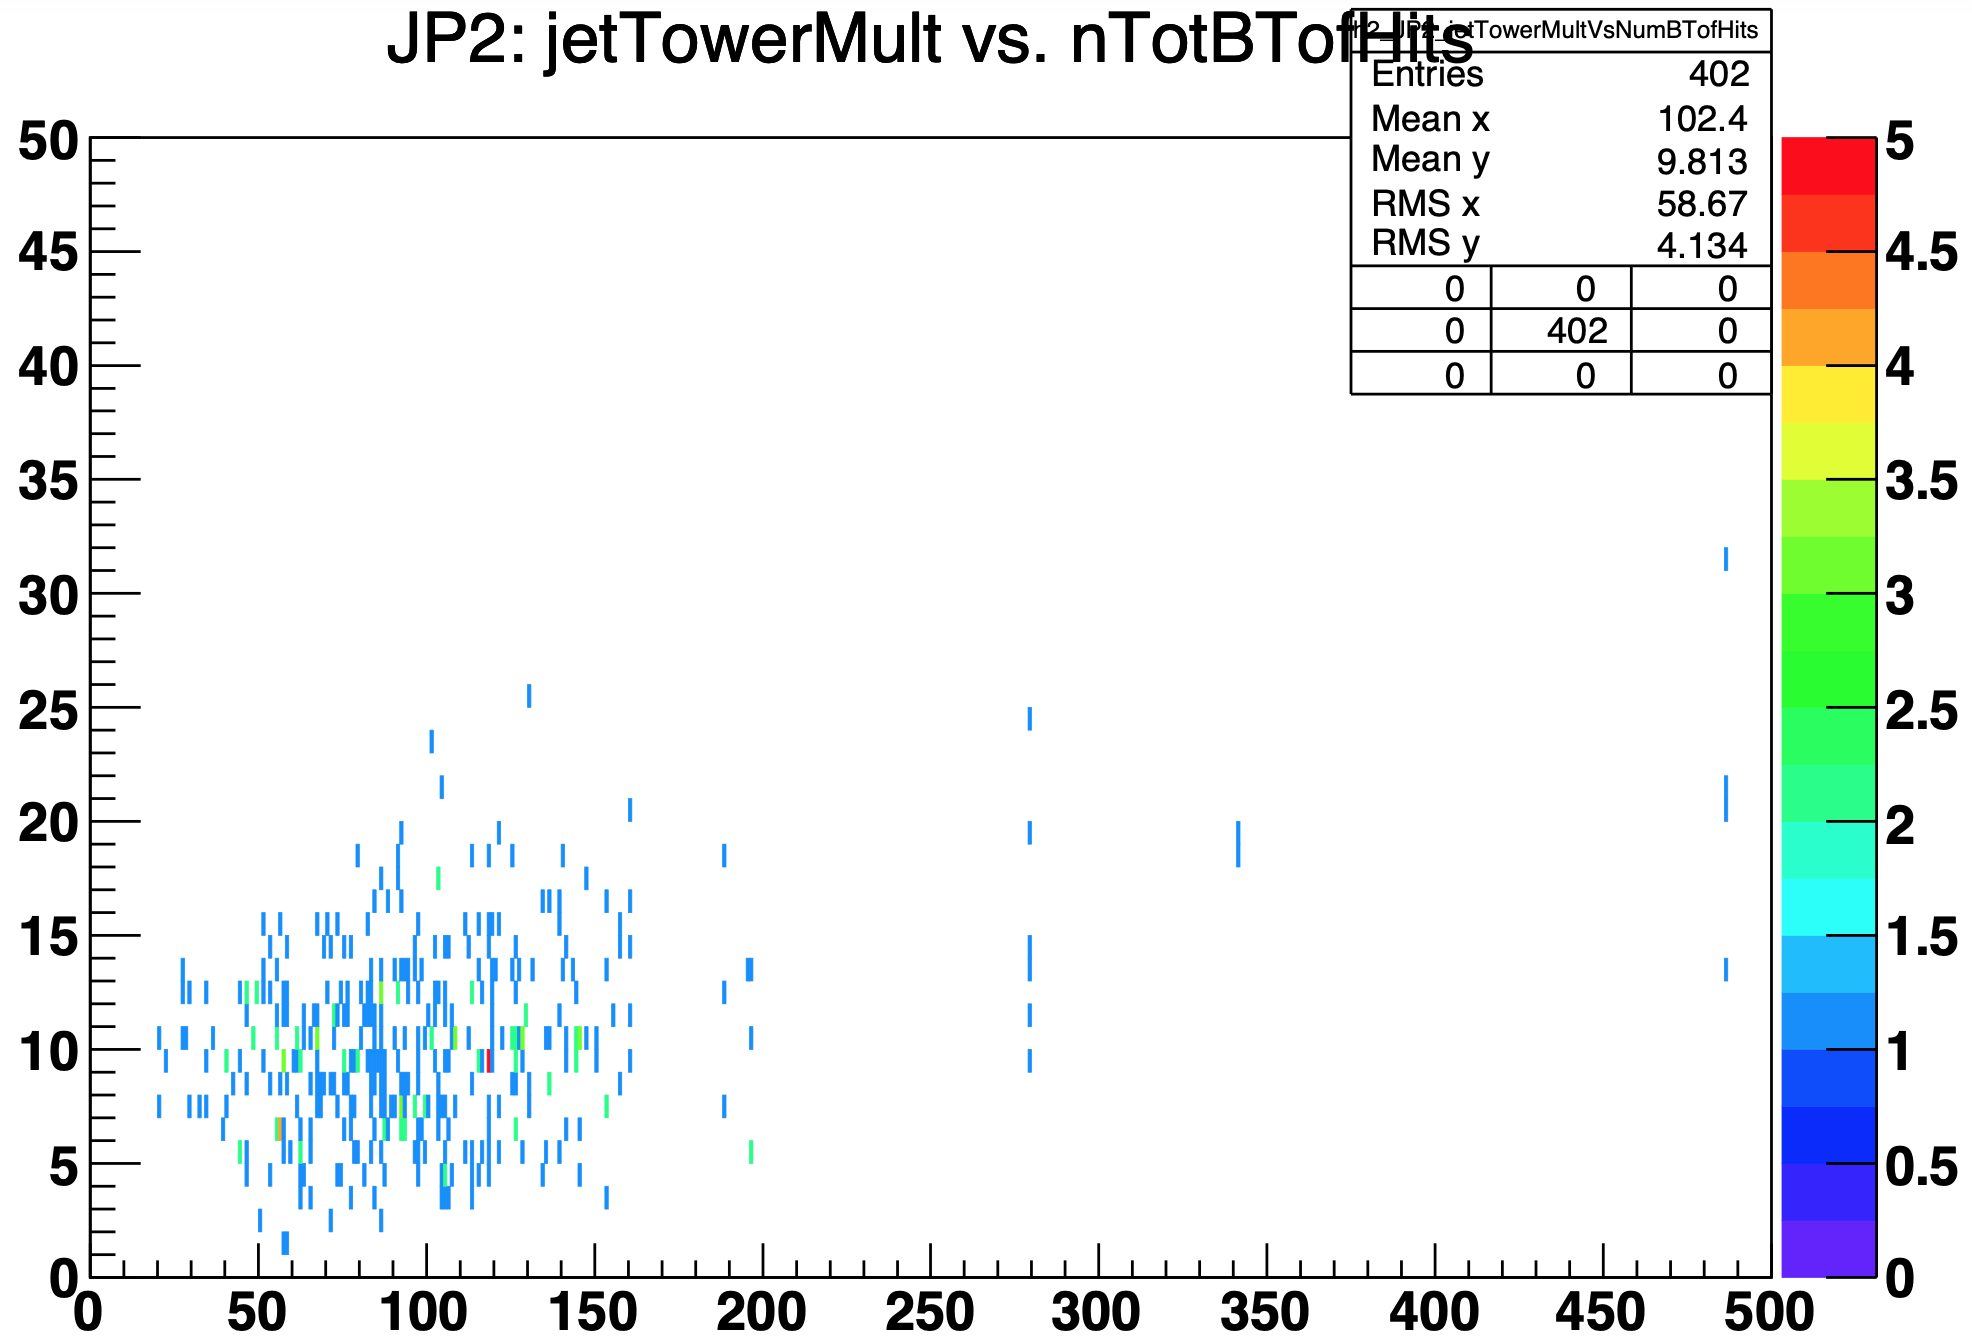
I tried both root -n and root4star -n and they both lead to the same output attached below. However, now the histogram title is a off and I also lost the grid. But, the time stamp did go away.
The solution ended up being that I added gStyle->SetOptDate(0) right before gStyle->SetOptStat(111111) in my plotting macro, and the timestamp went away. Below is the output.

 Below is the output.