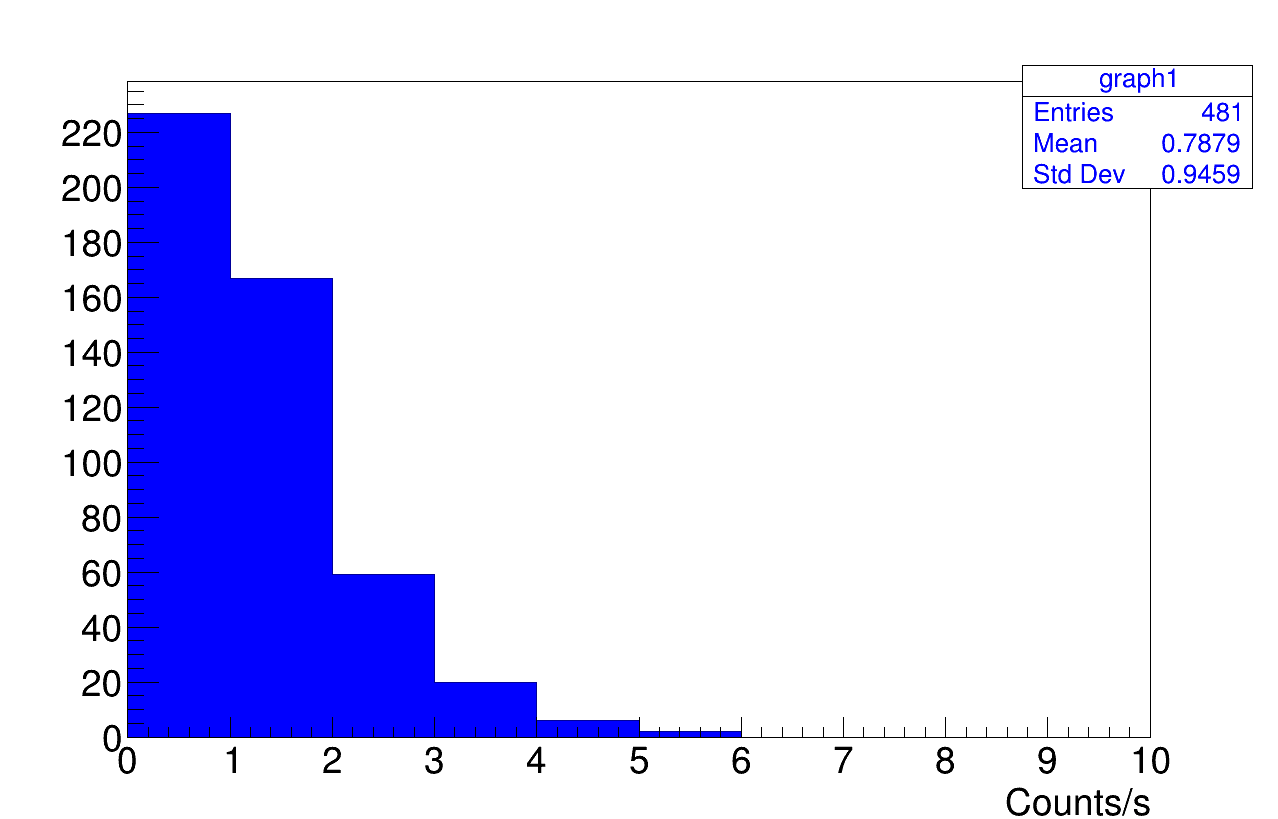
Hello, is it possible to modify a TH1F to plot it as a relative frequency?
I mean…I’m able to make a TH1F but on the y-axis I’ve the the number of the entries for each bin. Indeed…given that the total entries are 481, I want a relative frequency…then for example… 220/481=0.46…
background.cpp (2.0 KB)
backgrounddata.txt (2.4 KB)
Thank you
Please read tips for efficient and successful posting and posting code
ROOT Version: Not Provided
Platform: Not Provided
Compiler: Not Provided
Try:
graph1->DrawNormalized();
You will then also need:
TPaveStats *statsgraph1 = (TPaveStats*)gPad->GetPrimitive("stats");
Hello @Wile_E_Coyote thank you.
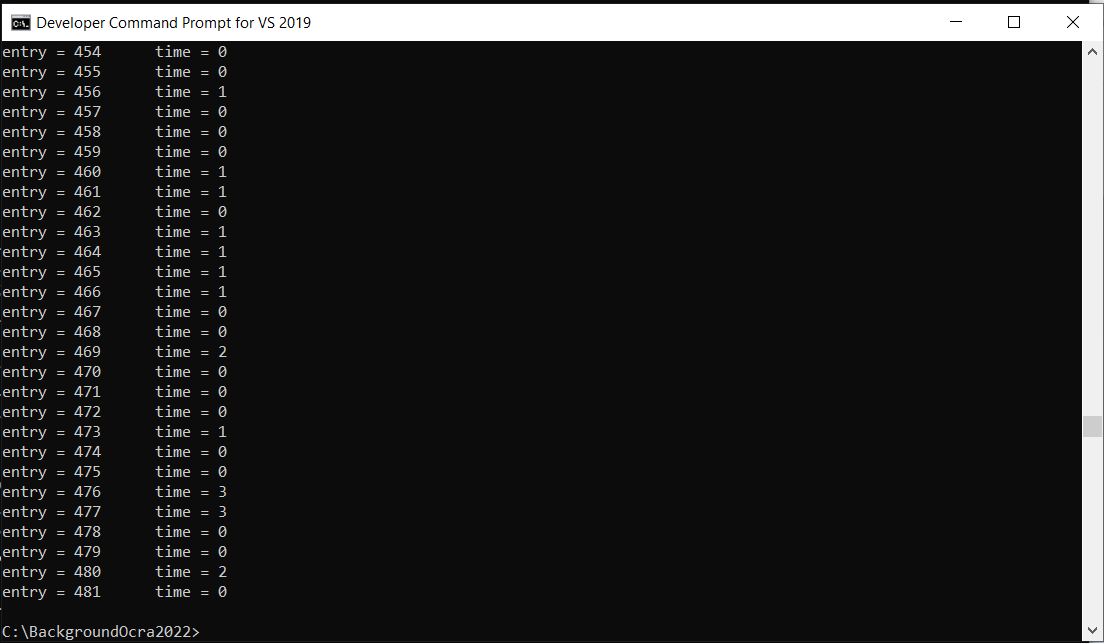
I tried by my computer (windows-based) but, as ou can see in this screen it stops without save the file
then I tried by vpn …(root on cvmf) and it works
@bellenot is it a windows problem?
Try:
graph1->Scale(1. / graph1->Integral()); graph1->Draw("HIST");
Thank you @Wile_E_Coyote, I will try it later because now I’ve first finish the graphs…
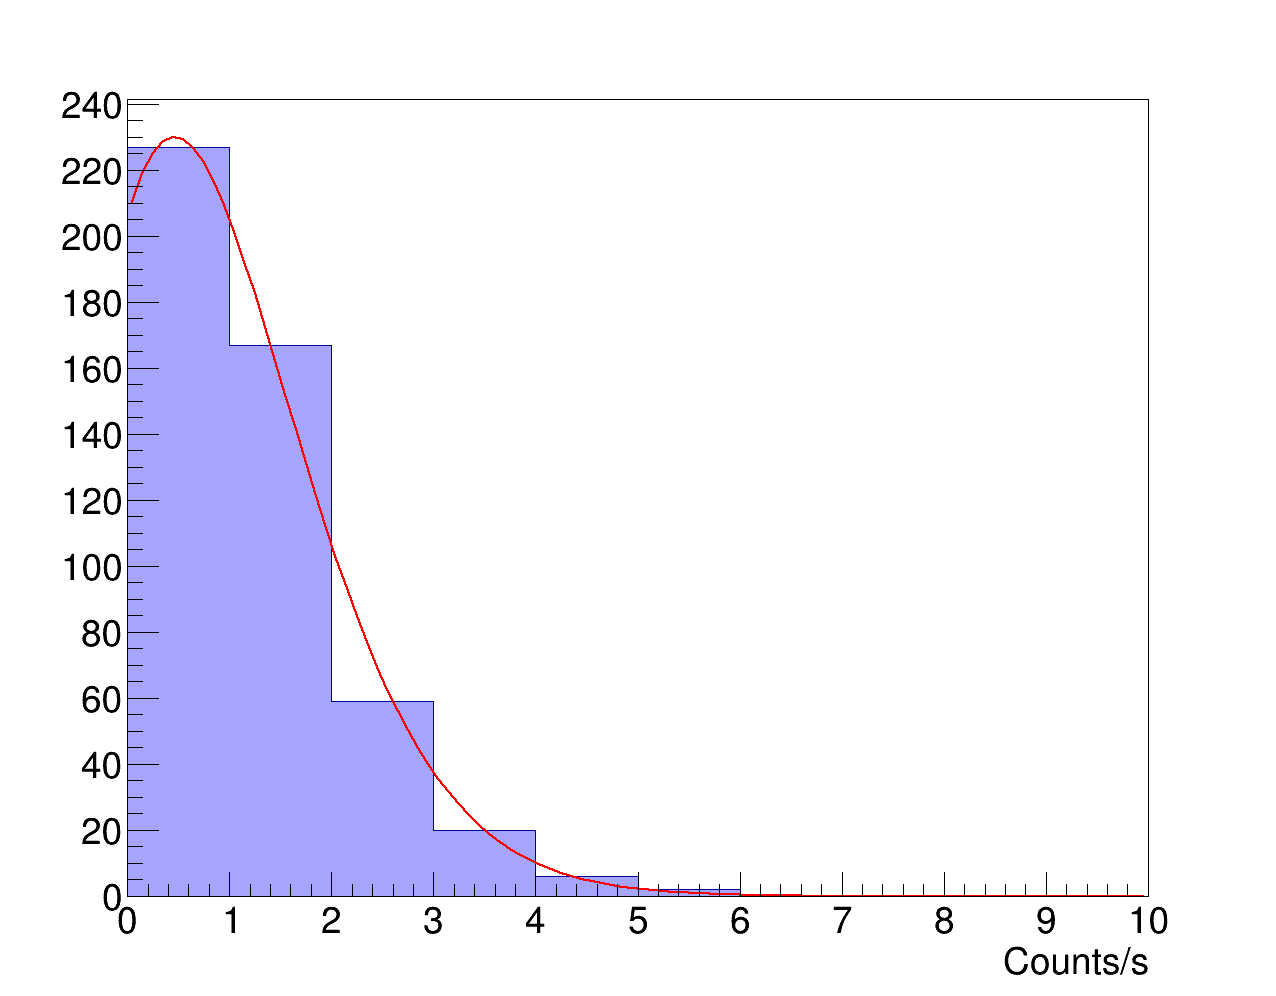
I noticed other problem (by vpn)… if I fit the data, it plots as a Draw, instead of DrawNormalized … is it normal?
background.cpp (2.4 KB)
TH1::DrawNormalized draws (and returns) a normalized copy of the histogram.
Instead, it seems you want to scale (and draw) the original one.
Th[quote=“Wile_E_Coyote, post:6, topic:49868, full:true”]
Instead, it seems you want to scale (and draw) the original one.
[/quote]
Is there a way to do it?
background.cpp (2.1 KB)
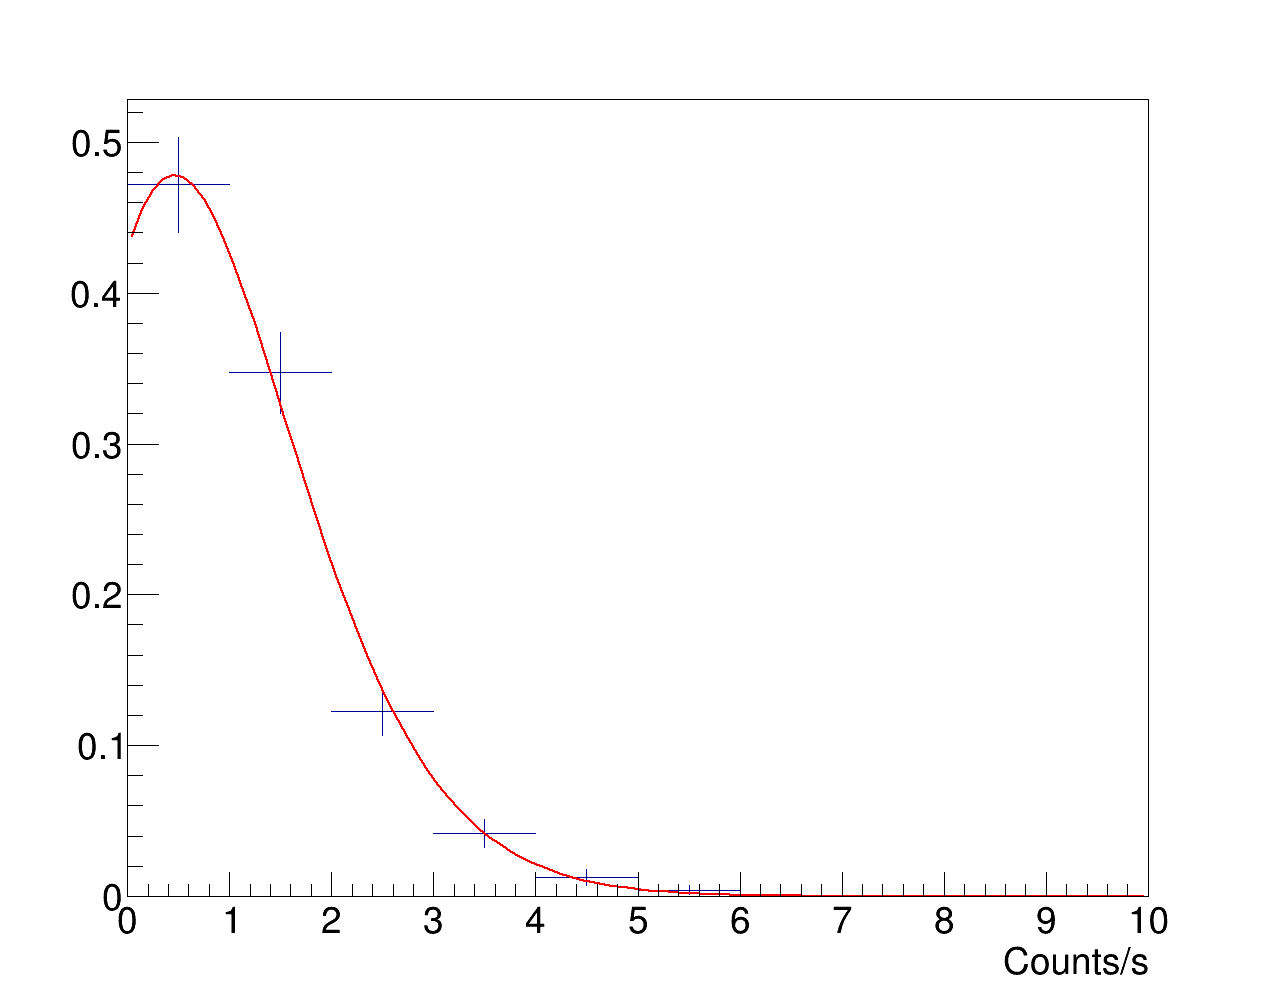
Thank you @Wile_E_Coyote it works but it makes points instead of bars…is it normal?
Try (after fitting):
graph1->Draw("HIST"); f->Draw("SAME");