Dear experts,
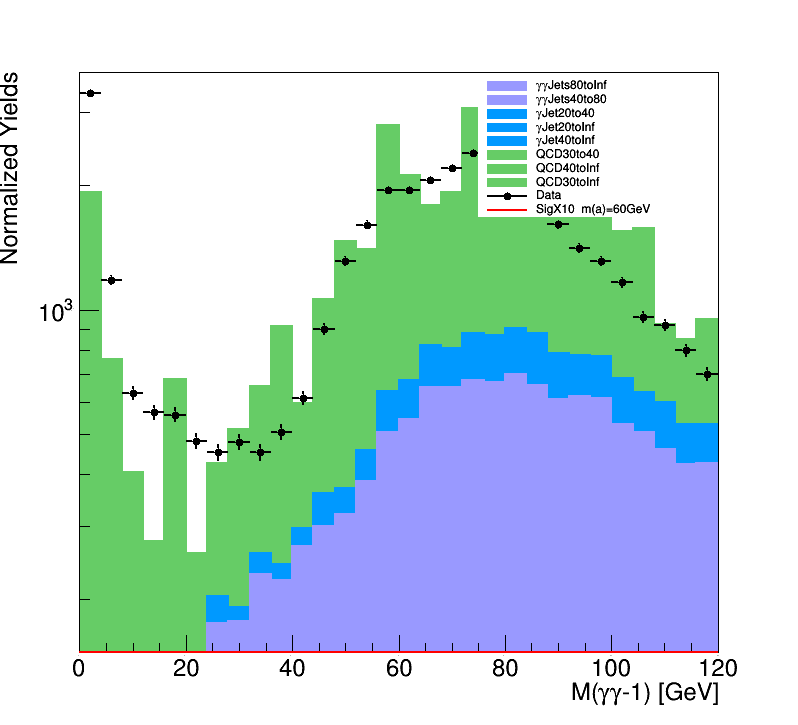
When I run this plotter code, the legend box overshadows some of the datapoints. Is there a way to draw the legend such that it does not cover any of the data points?
Thanks in advance,
Tanvi
## code to produce Data MC compariosn plots with signal on top

from PlotterToolsDataMC import *
from ROOT import *

gStyle.SetOptStat(0)
#first loop over all variables
for v in Vars:
   hists = []
   hists2 = []
   leg = TLegend(0.6, 0.7, 0.89, 0.89)
   leg.SetBorderSize(0)
   Max = -0.
   Max2 = -0.
   for fi,f in enumerate(MC):  ## get all MC plots, because they have to stacked!
      ch = TChain('H4GSel')
      ch.Add(f[0])
      hname = v[1]+'_'+str(fi)
      h = TH1F(hname, v[2], v[3], v[4], v[5])
      ch.Draw(v[0]+'>>'+hname,TCut(BlindCut)) ## add cut based on what you want to plot, blind or unblind or anything else
      h.Scale(float(f[4]),"nosw2")
      h.SetLineColor(f[2])
      h.SetLineWidth(2)
      h.SetFillColor(f[3])
      hists.append([h,ch,f[1]])
      if h.GetMaximum() > Max:
         Max = h.GetMaximum()
   #print "I AM MC MAX",Max

   for di,d in enumerate(Data):  ## now get data
      ch2 = TChain('H4GSel')
      ch2.Add(d[0])
      hname2 = v[1]+'_'+str(di)
      h2 = TH1F(hname2,v[2],v[3],v[4],v[5])
      ch2.Draw(v[0]+'>>'+hname2,TCut(Blind))
      h2.SetMarkerStyle(20)
      h2.GetYaxis().SetTitle('Normalized Yields')
      h2.SetLineColor(1)
      h2.SetLineWidth(2)
      h2.Sumw2()
   for si,s in enumerate(Signal):   ##plot signal on top
      ch3 = TChain('H4GSel')
      ch3.Add(s[0])
      hname3 = v[1]+'_'+str(si)
      h3 = TH1F(hname3,v[2],v[3],v[4],v[5])
      ch3.Draw(v[0]+'>>'+hname3)
      #h3.Sumw2()
      #total2 = h3.Integral()
      h3.Scale(float(s[3]))
      h3.SetLineColor(s[2])
      h3.SetLineWidth(2)
      #h3.Sumw2()
      #hists2.append([h3,ch3,s[1]])

      if h3.GetMaximum() > Max2:
        Max2 = h3.GetMaximum()
   #print "I AM SIGNAL MAX", Max2

   c0 = TCanvas('a','a',800,1000)   ##now starts the drawing part, start by stacking all the MC up
   s = THStack("s","")
   for fi,hh in enumerate(hists):
      leg.AddEntry(hh[0], hh[2], 'lf')
      s.Add(hh[0])
      hh[0].SetMaximum(Max*1.5)
      hh[0].SetMinimum(0.0001)
      if fi == 0:
         hh[0].Draw('')
      if fi > 0:
         hh[0].Draw('same')

   s.Draw("hist")
   s.GetXaxis().SetTitle(v[6])
   s.GetYaxis().SetTitle('Normalized Yields')
   s.GetYaxis().SetTitleOffset(1.6);

   h2.Draw('p same')
   h3.Draw('h same')
   leg.SetNColumns(3)
   leg.AddEntry(h2,"Data",'lp')
   leg.AddEntry(h3,"SigX10  m(a)=55GeV",'l')
   leg.Draw('same')

   #c0.Update()
   c0.SaveAs(outputLoc+v[1]+'.pdf')
   c0.SaveAs(outputLoc+v[1]+'.png')
   c0.SetLogy()
   c0.SaveAs(outputLoc+v[1]+'_log.pdf')
   c0.SaveAs(outputLoc+v[1]+'_log.png')