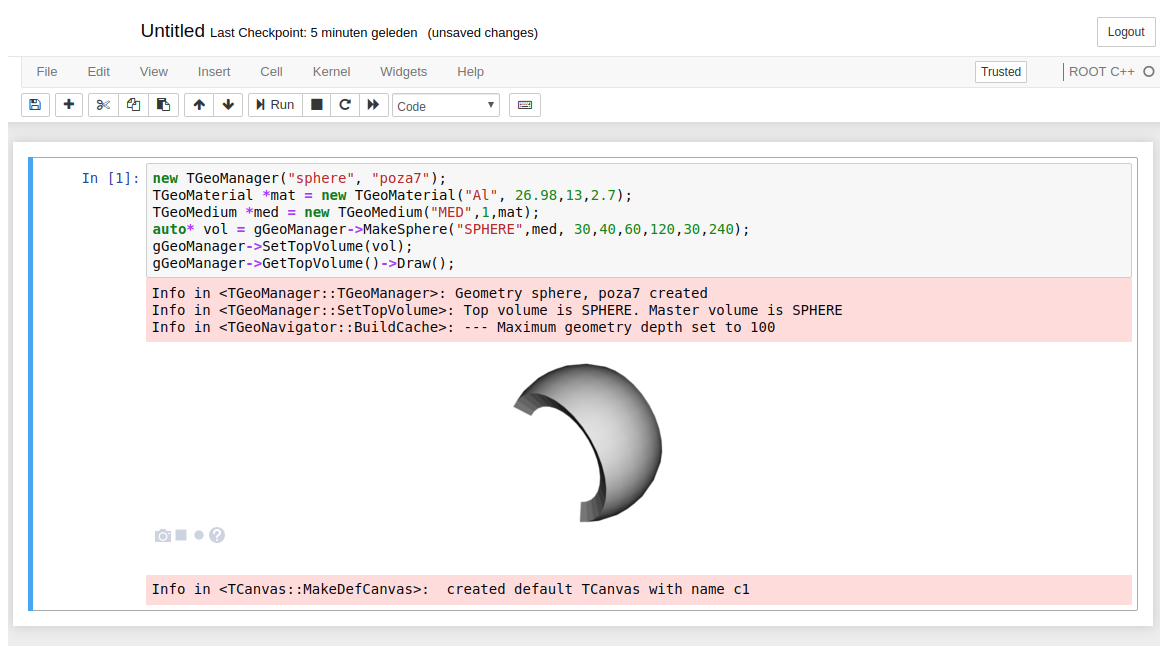
I found that the visualization output of ROOT in the jupyter notebooks are quite large (i.e. they take a lot of screen area as you can see from the image below).
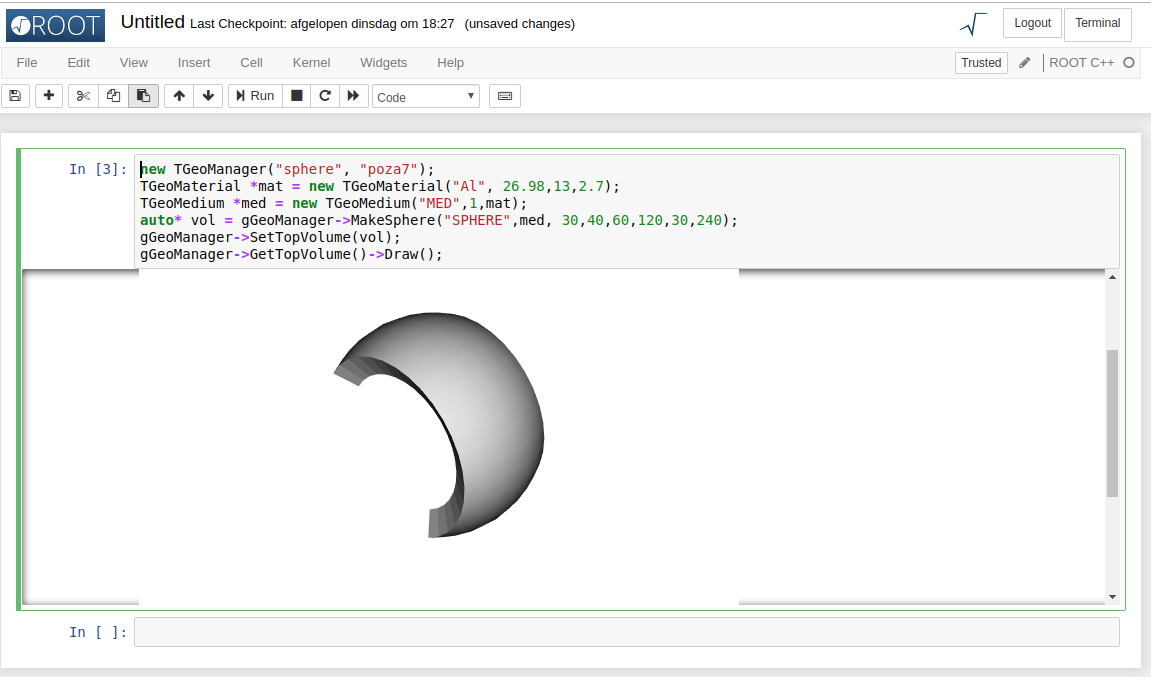
Is there a way to define the size of the cell, such as it’s height, and let the visualization output automatically readjust its size? Such that it becomes like this:
TCanvas cannot be used for TGeo visualization in JSROOT.
Unfortunately, I have no idea how size of output element in notebook can be configured in that case.
I don’t know how to handle the size of the cell output automatically in Jupyter, but if the size of the geometric bothers you, you can click on the left of the cell to make a scroll bar appear.
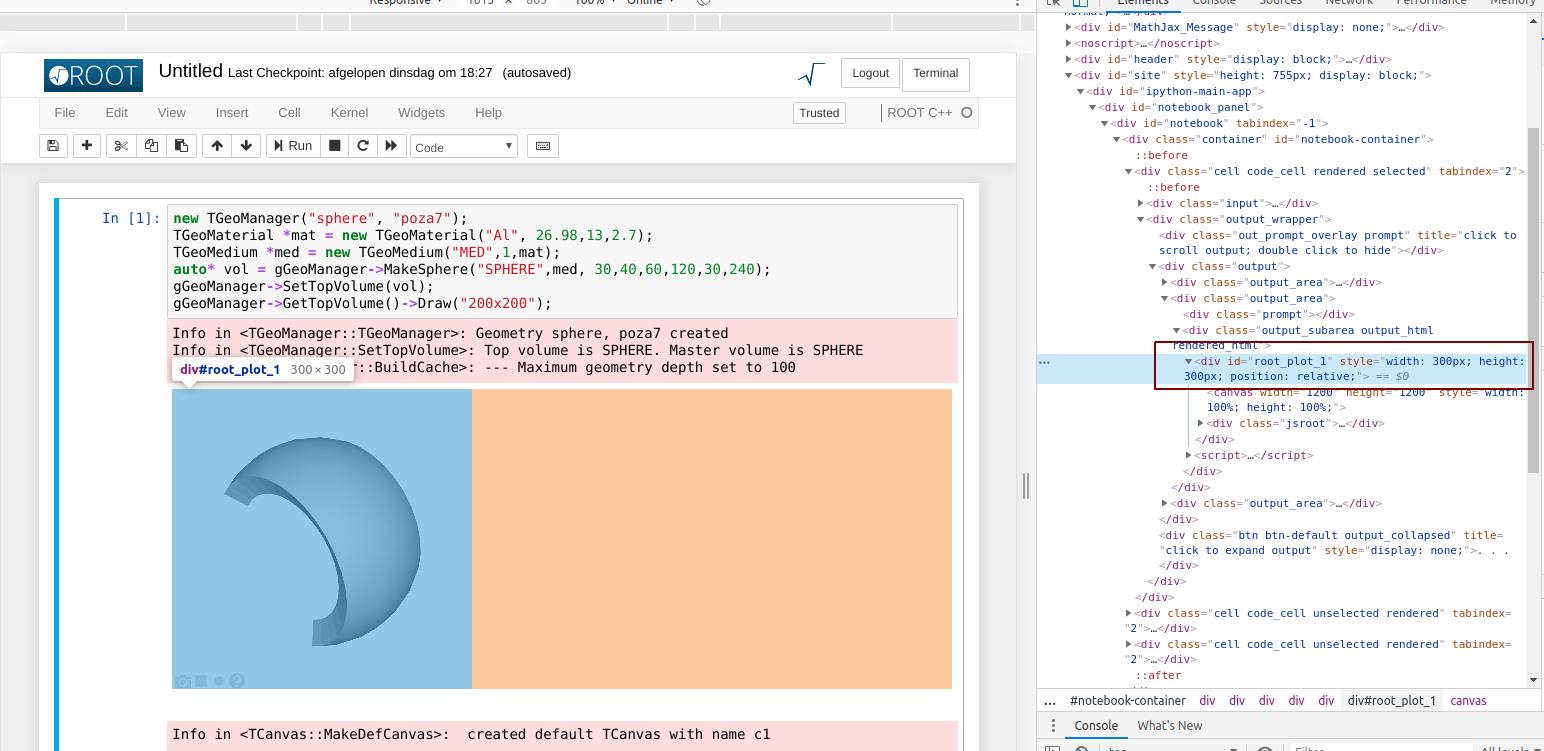
So I’m assuming somewhere in ROOT the dimensions of the JSROOT window are hard-coded? Would it be possible to set this myself? Or does any one have a pointer to where in the source code this is done?
This is side-effect of the fact, that iPython does not configures concrete height for HTML element, where geometry drawing is performed. Normally JSROOT tries to use complete provided space. But if element has zero height - JSROOT set heights to 66% of available width. But iPython does not automatically adjust its HTML to that size - one gets scrolling bars.
@etejedor Probably a solution can be that we provide in draw options size of the drawing. Something like gGeoManager->GetTopVolume()->Draw("400x200"). Question - could we forward somehow this draw options to JSROOT.draw() call?
No, there is no draw options stored in the gGeoManager (like in histogram classes).
Seems to be, I need to add support of TGeoManager in the TCanvas - but this requires some coding and will not be available very soon.
This is that happens when TCanvas drawing is performed. But TGeoManager object does not have such properties. Either I get them via drawing options or supporting drawing of TGeoManager in TCanvas. Both requires adjustments in current JSROOT code and iPython notebooks - means I also need help from @etejedor
which allows to embed TGeo object into TCanvas.
And TCanvas can resize top HTML element to preconfigured size.
Next week I plan to make next JSROOT release and it become available for iPython notebooks.
Thanks for the commit. I saw that you release JSROOT 5.8.0 a couple of days ago. Is it enough to merge these files into the js folder of my ROOT installation for the changes to take effect? Or are there still changes required in core ROOT code?
Another question: will the TGeo object be drawn automatically in the last-created TCanvas, or would I need to assign it to a specific canvas object?
You do not need to update your ROOT installation - for now jupyter notebooks using JSROOT from central web server - https://root.cern/js/notebook/ But you should update code how TGeo is displayed.
Something like:
%jsroot on
auto ccc = new TCanvas("ccc","title", 500, 500);
auto topVolume = gGeoManager->GetTopVolume();
ccc->GetListOfPrimitives()->Add(gGeoManager()->GetTopVolume());
ccc->Draw();
Here 500,500 is size of created canvas, which will be used for HTML elements.
Hope it works for you.
I noticed that having %jsroot on influences the output (i.e. if I don’t have it, I get a static image of the wireframe of the object). Is there a way to turn this on globally? If so, is there a problem with doing so?
And I just want to let you know of a small bug: as you can see from the image, the output is drawn slightly on top of the menu bar.
%jsroot on turns on the JS visualization per notebook, there is unfortunately no setting to make it the default. But it will become default when the new JS graphics do too.
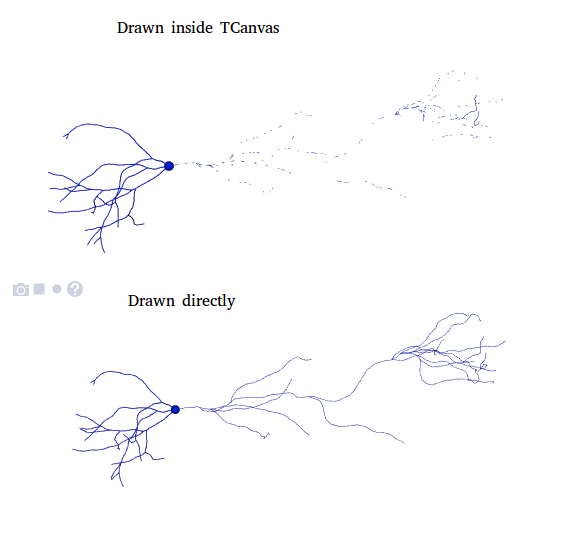
I just noticed one more problem today with the canvas approach. When I have a large number of TVolume objects (inside one top volume) that need to be drawn, the canvas does not draw all of them. Drawing them directly with TVolume::Draw() all the objects are drawn.
With TVolume there is a TVolume::SetMaxVisNodes(), which I set to a number higher than the total number of objects I have. Is there something similar with TCanvas? I did not found something similar…
I guess, you mean TGeoManager::SetMaxVisNodes(). You should add gGeoManager itself to the TCanvas - in that case it will be streamed with it setting and provided to JSROOT.
Yes sorry, I meant TGeoManager::SetMaxVisNodes(). I was adding the gGeoManager->GetTopVolume() to the ListOfPrimitives of the canvas so far. But even adding gGeomanager instead results in the same undesired behavior of missing objects, unfortunately…
The flow of my code is as follows:
gGeoManager = new TGeoManager("Visualization", "BioDynaMo");
TCanvas* canvas_ = new TCanvas("name", "title", 300, 300);
top_ = new TGeoVolumeAssembly("WORLD");
gGeoManager->SetTopVolume(top_);
canvas_->GetListOfPrimitives()->Add(gGeoManager);

// The following code block is executed a couple of times
{
// First clear and then populate top_
...

canvas_->Update();
canvas_->Draw();
}
The call to canvas_->Draw() does not display all the objects I added to top_, whereas the call to gGeoManager->GetTopVolume()->Draw() does display all objects.
auto ccc2 = new TCanvas("ccc2","title", 1000, 1000);
gGeoManager->SetMaxVisNodes(1000);
gGeoManager->SetVisLevel(4);
const char *opt = "more"; // "more3", "all"
ccc2->GetListOfPrimitives()->Add(gGeoManager, opt);
ccc2->Draw();
But there are other limitations - number of faces in produced geometry .
To increase this number, one have to specify drawing options as in example: “more” or “more3” or “all”
Try if it works for you.
Unfortunately, even after setting the drawing options to “all”, and the VisLevel to 4, the problem is still there. This is the output that I’m getting (the curly lines consists of many Tube objects):