Reduce dask cluster idle time with RDataframe

Dear expert,

I have been trying to use RDataframe with DASK to create histograms from flat ntuples.

Including the systematics variation, there are thousands of histograms that make it impossible to run in one shot (exceeding the memory limit on the scheduler).
I try to break it down into several small batches to reduce the size of the graph.

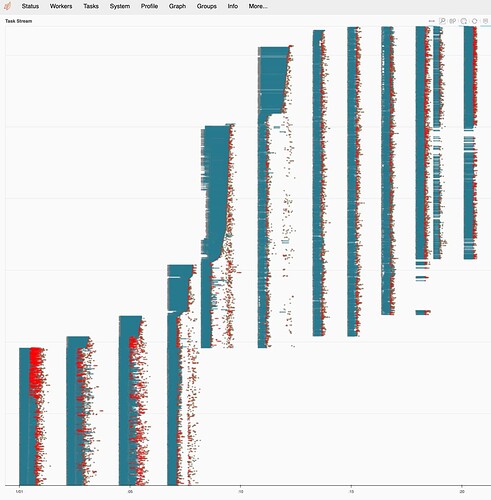
However, as seen in the benchmark plot, there is a very long idle time waiting for the previous RunGraph to finish and start the next one.

I was wondering if there is a better way to reduce idle time?

Does RDataframe support something like fire_and_forget from dask.distributed


ROOT Version: ROOT 6.26/04
Platform: CentOS7
Compiler: gcc11


Hi @ytchoutw ,

and welcome to the ROOT forum!

@vpadulan might know. In principle the way to reduce the idle time is to run all event loops concurrently, but as you mentioned in your case it’s too memory intensive I am not sure what we could do.

Cheers,
Enrico

Dear @ytchoutw,

I am going to assume that in your case you are trying to process remote files via xrootd (e.g. by passing a list of filenames with the root:// prefix when creating the RDataFrame). In that case, most probably what you are experiencing is a delay in creating the tasks to be sent to Dask. In 6.26, RDataFrame needs to open all files to get the number of entries so that it can properly split the input dataset in different tasks. Opening a remote file is sometimes a costly operation (and of course scales linearly with the number of files you are processing). This limitation is removed in 6.28 (next ROOT release), so that the files are only opened once the tasks arrive on the distributed nodes. Your client application will create tasks without opening files.

I am taking note of your suggestion about fire_and_forget. I will look into a possible implementation. Your current problem is solved in the next ROOT release.

Cheers,
Vincenzo

1 Like

Thanks for looking in to this!

If there is any new features available in the nightly build. I am happy to help testing them.

Cheers,
Yuan-Tang

Dear @ytchoutw ,

Thank you so much for proposing, that’s really appreciated!

If you have access to cvmfs you could try to source the latest nightly, e.g.
source /cvmfs/sft.cern.ch/lcg/views/dev3/latest/x86_64-centos7-gcc11-opt/setup.sh
and run again your application. That should already show much less delay between different RunGraphs calls.

Cheers,
Vincenzo

1 Like

(in case it’s useful, nightly builds of ROOT as a conda package are also available, see Nightlies - ROOT )

1 Like

Thanks for the pointer!

I have a quick try with the LCG nightly. I do see a significant reduction in idle time and memory consumption in the scheduler.

One caveat is that the requirement for disk bandwidth seems to increase significantly. The jobs will just crash if too many threads or workers are requested ( > 100 threads reading from a gpfs local disk).

But overall, the job does run more efficiently.

Cheers,
Yuan-Tang

Well of course that shouldn’t happen :sweat: is there an error message or a stacktrace reported? What does python -c 'import dask; print(dask.__version__)' print?

The DASK version is 2022.6.1

There are two types of warnings/errors I see in logs. Sorry, I’m not sure if these are helpful.

This is a small background ntuple. In the end, I need to reduce to only 5 worker nodes.

The majority are

2022-11-04 15:56:49,777 - distributed.worker - WARNING - Compute Failed
Key:       dask_mapper-48e62520-a687-4bca-ae1a-60eba0dc167a
Function:  execute_task
args:      ((<function DaskBackend.ProcessAndMerge.<locals>.dask_mapper at 0x7f8f54b160d0>, (<function apply at 0x7f8fc96fcb80>, <class 'DistRDF.Ranges.TreeRangePerc'>, (), (<class 'dict'>, [['id', 38], ['treenames', ['nominal_Loose']], ['filenames', ['/gpfs/slac/atlas/fs1/d/yuchou/H2a4b/Level2/supermerged_SOLARBv6p9//2ji3bobji/single_top_mc16d_Wt_FS.root']], ['first_file_idx', 0], ['last_file_idx', 1], ['first_tree_start_perc', 0.42500000000000004], ['last_tree_end_perc', 0.4624999999999999], ['friendinfo', None]]))))
kwargs:    {}
Exception: "AttributeError('__enter__')"

I also see one error as follow

2022-11-04 15:57:04,206 - distributed.worker - ERROR - failed during get data with tcp://134.79.21.47:36421 -> tcp://134.79.21.56:35747
Traceback (most recent call last):
  File "/cvmfs/sft-nightlies.cern.ch/lcg/views/dev3/Fri/x86_64-centos7-gcc11-opt/lib/python3.9/site-packages/distributed/comm/tcp.py", line 229, in read
    frames_nbytes = await stream.read_bytes(fmt_size)
tornado.iostream.StreamClosedError: Stream is closed

The above exception was the direct cause of the following exception:

Traceback (most recent call last):
  File "/cvmfs/sft-nightlies.cern.ch/lcg/views/dev3/Fri/x86_64-centos7-gcc11-opt/lib/python3.9/site-packages/distributed/worker.py", line 1674, in get_data
    response = await comm.read(deserializers=serializers)
  File "/cvmfs/sft-nightlies.cern.ch/lcg/views/dev3/Fri/x86_64-centos7-gcc11-opt/lib/python3.9/site-packages/distributed/comm/tcp.py", line 245, in read
    convert_stream_closed_error(self, e)
  File "/cvmfs/sft-nightlies.cern.ch/lcg/views/dev3/Fri/x86_64-centos7-gcc11-opt/lib/python3.9/site-packages/distributed/comm/tcp.py", line 150, in convert_stream_closed_error
    raise CommClosedError(f"in {obj}: {exc}") from exc
distributed.comm.core.CommClosedError: in <TCP (closed)  local=tcp://134.79.21.47:36421 remote=tcp://134.79.21.56:58968>: Stream is closed
2022-11-04 15:57:04,208 - distributed.core - INFO - Lost connection to 'tcp://134.79.21.56:58968'
Traceback (most recent call last):
  File "/cvmfs/sft-nightlies.cern.ch/lcg/views/dev3/Fri/x86_64-centos7-gcc11-opt/lib/python3.9/site-packages/distributed/comm/tcp.py", line 229, in read
    frames_nbytes = await stream.read_bytes(fmt_size)
tornado.iostream.StreamClosedError: Stream is closed

The above exception was the direct cause of the following exception:

Traceback (most recent call last):
  File "/cvmfs/sft-nightlies.cern.ch/lcg/views/dev3/Fri/x86_64-centos7-gcc11-opt/lib/python3.9/site-packages/distributed/core.py", line 777, in _handle_comm
    result = await result
  File "/cvmfs/sft-nightlies.cern.ch/lcg/views/dev3/Fri/x86_64-centos7-gcc11-opt/lib/python3.9/site-packages/distributed/worker.py", line 1674, in get_data
    response = await comm.read(deserializers=serializers)
  File "/cvmfs/sft-nightlies.cern.ch/lcg/views/dev3/Fri/x86_64-centos7-gcc11-opt/lib/python3.9/site-packages/distributed/comm/tcp.py", line 245, in read
    convert_stream_closed_error(self, e)
  File "/cvmfs/sft-nightlies.cern.ch/lcg/views/dev3/Fri/x86_64-centos7-gcc11-opt/lib/python3.9/site-packages/distributed/comm/tcp.py", line 150, in convert_stream_closed_error
    raise CommClosedError(f"in {obj}: {exc}") from exc
distributed.comm.core.CommClosedError: in <TCP (closed)  local=tcp://134.79.21.47:36421 remote=tcp://134.79.21.56:58968>: Stream is closed

I think we saw similar issues with dask 2022.6.1 that were fixed (in dask) in 2022.8.1. @vpadulan can correct me if I’m wrong.

Hi!
Sorry for the late reply. Indeed, Dask has corrected a few critical bugs and currently we see that since version 2022.8.1 those are resolved. You could try pip install --user dask==2022.8.1 distributed==2022.8.1 in your environment after sourcing the cvmfs view, which should take priority over the Dask installation from cvmfs.

I’d like to understand further some of your earlier messages.

One caveat is that the requirement for disk bandwidth seems to increase significantly

I’m not sure why this would happen. The RDataFrame is reading exactly as much data as before. Do you see the increase in reading or writing?

The jobs will just crash if too many threads or workers are requested ( > 100 threads reading from a gpfs local disk)

Are you using Dask workers with multiple Python threads? In general that is not what you want in this case. E.g. using a Dask LocalCluster as example:

# Don't use this
# LocalCluster(processes=False, n_workers=1, threads_per_worker=N)
# Use this instead
LocalCluster(processes=True, n_workers=N, threads_per_worker=1)

How are you creating the Dask cluster?

But overall, the job does run more efficiently.

Does this mean that your analysis finishes with the correct output, even though you sometimes see the errors from the worker logs?

Cheers,
Vincenzo

This topic was automatically closed 14 days after the last reply. New replies are no longer allowed.