RDF Runtime Log Info

Dear experts,

Apologies in advance if I garble the ROOT jargon. I am trying to run some Python code which makes some plots from a few TB of root files. Essentially, the code creates an RDataFrame from a Chain, and then iterates over all the events in the RDataFrame, makes plots, etc.

I’ve been trying to test some MultiThreading implementation (via the line ROOT.ROOT.EnableImplicitMT(n)) with this framework and have noticed some peculiar and wildly inconsistent runtime behavior between runs (even identical ones with the same “n” in the MT settings), although I’m not sure if it’s related to the details of ROOT’s EnableImplicit MT functionality or if it’s something server-side which is limiting performance.

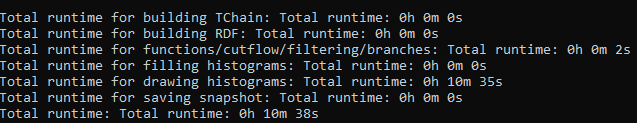
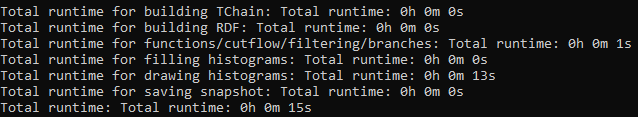
Is there a nice way of outputting some sort of detailed log information when ROOT is building the chain, making the RDF, iterating over things in the RDataFrame, etc., like presenting runtime, number of threads, or other info during the run? So far, I have the following lines, although these are probably decently outdated, and they don’t really provide much information to go off of:

verbosity = ROOT.Experimental.RLogScopedVerbosity(ROOT.Detail.RDF.RDFLogChannel(), ROOT.Experimental.ELogLevel.kInfo),

ROOT.RDF.Experimental.AddProgressBar(self.rdf)

Is there anything else you might suggest? Basically, we just want to debug where ROOT is spending time exactly with a given run, and if possible, what exactly it’s choosing with respect to the “n” in the EnableImplicitMT line (if I understand correctly, I know this parameter is more of a “hint” or so for ROOT to best choose how to parallelize?).

Thanks for your help!
Philip Meltzer

ROOT Version: 6.32.02
Platform: Linux
Compiler: GCC

Hello Philip,

when you pass an argument to EnableImplicitMT, this is exactly the number of threads ROOT will use. It of course depends on your OS and the load of the machine whether all of these threads are actually running at full speed.
If we can assume exclusive access to the machine and if you are not limited by cgroups, a scheduling policy, a container environment or the VM hypervisor, ROOT should fully use N CPUs, unless the data are not flowing in fast enough.

For that reason, the easiest check you can do is to run htop or similar while RDF is running. If you see N times 100% CPU, your analysis is CPU bound. If you see less, it’s the storage backened that cannot supply the data fast enough.

RDF doesn’t have a a higher loglevel, but there is a kind of benchmark tool, ROOT Readspeed. You can think of it like using a dataframe that decompresses and touches the data but doesn’t do anything with them. You can give that a go if you want to test how much bandwidth you can get out of your storage.

One example:

bin/rootreadspeed --files root://eospublic.cern.ch//eos/opendata/cms/derived-data/AOD2NanoAODOutreachTool/Run2012BC_DoubleMuParked_Muons.root --trees Events --all-branches --threads 8
Total number of tasks: 75
Thread pool size:		8
Real time to setup MT run:	0.313115 s
CPU time to setup MT run:	0.29 s
Real time:			21.3538 s
CPU time:			37.77 s
Uncompressed data read:		3232610772 bytes
Compressed data read:		2243313339 bytes
Uncompressed throughput:	144.37 MB/s
				18.0463 MB/s/thread for 8 threads
Compressed throughput:		100.188 MB/s
				12.5235 MB/s/thread for 8 threads

CPU Efficiency: 		22.1096%

In this case, since I’m not doing anything with the data, I cannot go significantly higher than the typical speed of the storage backend, which I know from experience is about 150MB/s.
So using 8 threads is actually a bit overkill here.

Hi Stephan,

Thanks for the advice; this helps a lot!

On a related note, I made a very simplified plotting macro to operate on some root files and plot some very basic quantities (number of electrons, number of muons, etc.). I notice that for an input directory of about 3.0 TB of root files (consisting of around 2 billion events or so), there is a massive difference in runtime between the first instance in which I run the code, and a second run I conduct immediately after (the difference is on the order of a 98% reduction in runtime, from about 638 seconds to 15 seconds - see screenshots below). I presume this is mainly due to “caching”, but I am not very familiar with how it works at a fundamental level with respect to root. What is actually “cached” when it comes to a Python script which creates a TChain, RDataFrame, 1D histograms, etc. in a typical run, such that this incredible difference in runtime is expected?

Thanks again for your help!
Philip Meltzer

Pre-cache run:

Post-cache run (immediately after previous run):

(P.S.: I didn’t actually save a snapshot in this run but left the print statement in, hence the 0 runtime for making a snapshot which would usually take a lot of time.)

Hello Philip,

in between runs, ROOT doesn’t cache anything at all. ROOT can read ahead, meaning that it can request the next parts of a file while you are still processing another part, but that’s it.

Everything you see in terms of speedup when you do a second run is your operating system or the distributed filesystem or a network cache that you are reading from.
I doubt that those caches can store 3 TB (it’s possible, but expensive), so I think what’s going on is that you are reading only a small part of these 3 TB, so only the relevant parts are cached. ROOT is actually very good at reading only the parts that you need, so you might be storing some GBs in that cache, and on the second run, all of those arrive directly from the cache.

In order to explain a bit better, we would need to know what you are reading from and how much of the file is actually read. If you use rootreadspeed and enable only the branches that you were plotting from, you should get those numbers. Alternatively, you can monitor disk or network I/O while running the plotting script and infer how many of those 3 TB are read.