I am trying to process some xAOD ntuples using RDataFrame with multithreading enabled. However, the multithreaded performance is at least 10 times slower than the single threaded performance, despite showing much higher CPU usage. It seems to be platform dependent. I ran a test script with/without multithreading with same root version (ROOT 6.30/04) and gcc version (12.3.0), on perlmutter (Linux 5.14.21-150400.24.81_12.0.87-cray_shasta_c) and on lxplus. The multithreading issue is found on perlmutter but not lxplus. Below are the details of my checks:
Thanks for the post and measurements. Let me add in the loop @mczurylo and @vpadulan.
Looking at the flamegraph and code, my first Ansatz would be IO latency on Perlmutter. You are basically just counting entries, without deserialising and uncompressing much.
I expect on a local machine to see the same behaviour of lxplus: did you check that?
I tested on local cluster from my institute (which uses alma linux) and it behaves similar to lxplus. I don’t have local machines with the same architecture as Perlmutter so I can’t test that.
Thanks: that helps.
I do not think it’s the node architecture that counts here but the way in which it accesses storage. I am not familiar with Perlmutter, but can it be that you are trying to read the root file from some network attached storage that cannot sustain the reads coming from the many cores on the node? Could you perhaps try to move the file(s) on the local storage of the Perlmutter node?
In this particular case I am not sure ROOT can help a lot on the software side.
Is the number of cores used on the Perlmutter node and your University cluster similar?
One option I may suggest is to contact the Perlmutter helpdesk to ask about this performance regression.
Hi @Danilo ,
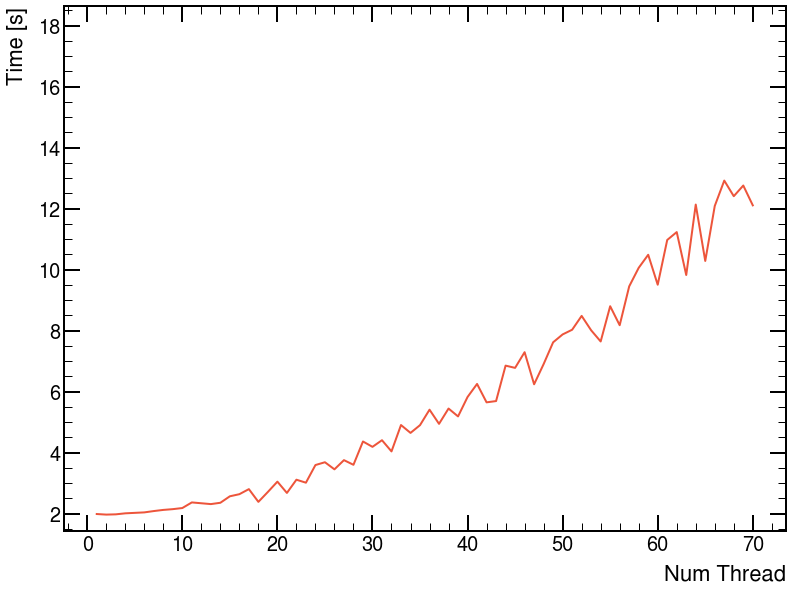
Thanks for the reply! It gave me some insights into what the problem might be. Each node on Perlmutter has 64 cores (or more). So it makes me think that maybe we are using too many threads. Since we can set the number of threads used when calling ROOT.EnableImplicitMT, I did some tests and indeed the run time increases with the number of threads. I don’t know what default values ROOT sets it to (tbb::task_scheduler_init::default_num_threads() from my understanding) but the default gives an extremely long runtime of > 100 s. Below is the benchmark plot:
The default number of threads is the number of hardware cores on the node, as per TBB functionality.
I am sorry you are experiencing this issue on Perlmutter. If I had to summarise the current status, according to the information we have at the moment, I do not think this behaviour is an issue of ROOT but of the node configuration (ROOT works fine on a variety of other configurations, as you confirmed).
apart from I/O latency (which could still be the case if /tmp is a network filesystem), there is one common cause which could slow your program down, and that’s the cpu scheduler limiting the amount of CPU time.
Basically, if you asked for a job with 8 CPUs, and you land on a node that has 64 cores, ROOT might well start 64 threads (the number of cores exposed by TBB, as you noted). If your process runs in a cgroup with CPU time limits, like e.g. in docker containers or for some batch systems, ROOT might be able to find out that you are only allowed to use 8 cores, so it would limit itself to 8 threads.
Nevertheless, this detection might fail … In this case, the CPU scheduler will run the 64 threads for a bit, and stop them once they have consumed the CPU time of 8 threads. Then, they wait 7/8 of the scheduler interval, get woken up, run for 1/8, get stopped, sleep, get woken up, and so on.
When this happens, your program will get slower as you increase the number of threads without asking for more CPUs.
Whether this is the case is hard to say from the flame graph, but you should be able to check your job options for the number of cores that’s assigned.
Thanks for the detailed explanation so far. I will ask a question that I have not seen yet, what is the size of this file? For just counting the entries, if the file is anywhere less than O(10GB), using 64+ cores to parallelize the counting might be counterproductive, just the extra scheduling of the TBB threads might be too much.
Also, even the original post showing the difference in CPU usage on lxplus: 300% for the single-thread case and 250% for the IMT case? That’s suspicious. In any case, feel free to share the file with me privately and I will try to reproduce.
I can measure with/without IMT and with an increasing number of files (given by the input argument to the constructor of std::vector). All runs have been repeated many times so we are sure the file is in the filesystem cache.
1 file, single thread
real	0m1.706s
user	0m1.336s
sys	0m0.366s
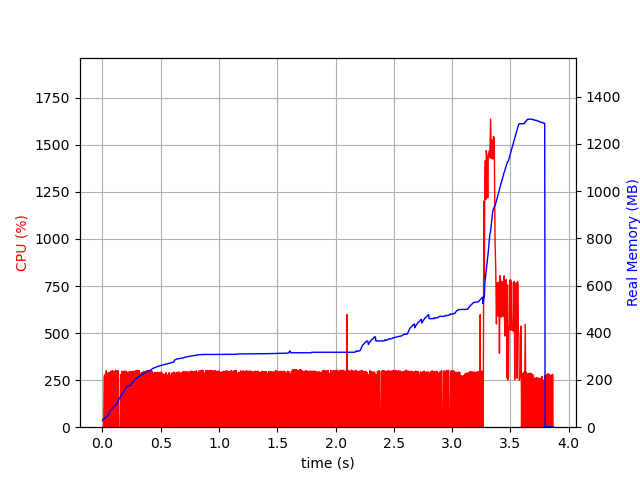
1 file, 2 threads
real	0m2.460s
user	0m2.481s
sys	0m0.694s
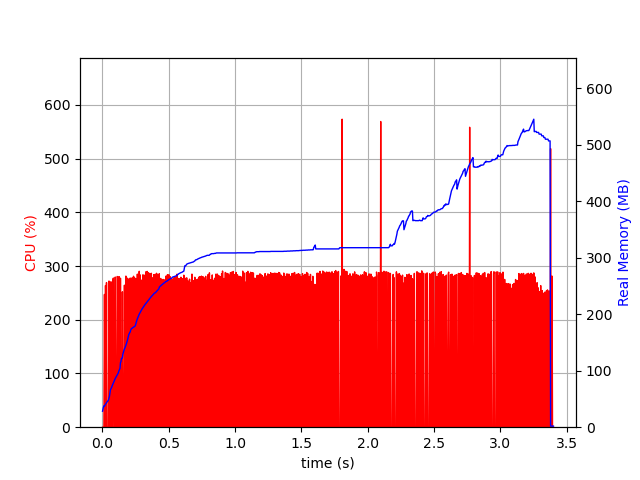
1 file, 16 threads
real	0m3.310s
user	0m11.456s
sys	0m4.871s
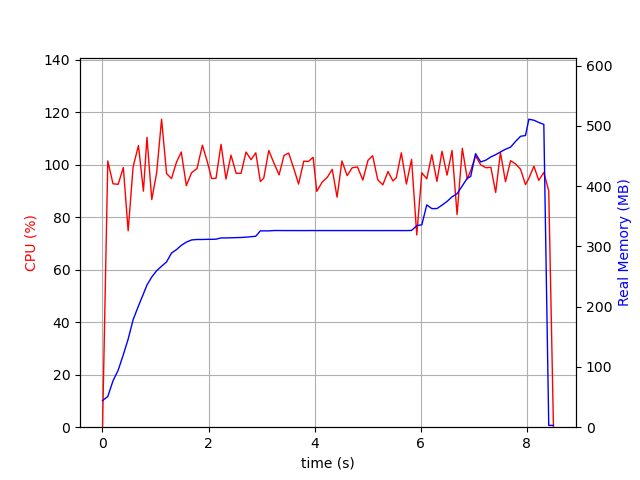
10 files, single thread
real	0m7.680s
user	0m6.438s
sys	0m1.218s
10 files, 16 threads
real	0m3.292s
user	0m17.377s
sys	0m5.405s
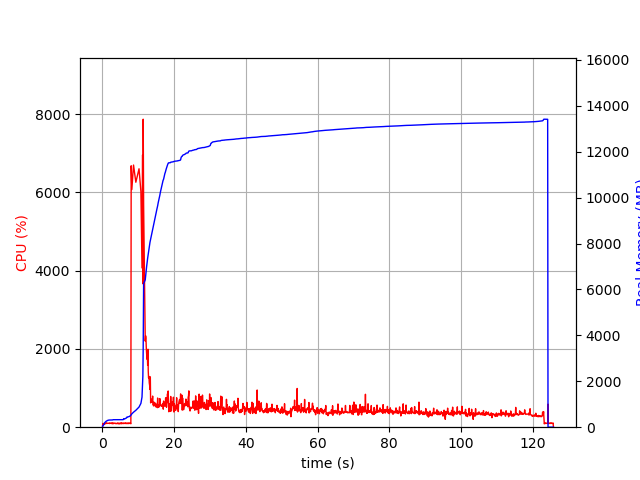
100 files, single thread
real	1m7.463s
user	0m57.759s
sys	0m9.484s
100 files, 16 threads
real	0m8.461s
user	1m14.260s
sys	0m17.038s
As you can see, the dataset in this file is just too small to benefit from IMT just for the simple task of counting its entries. The larger the dataset, the less the overhead of having a parallel execution is visible and its benefits really start showing. As usual, one either has to have a very compute-intensive graph, or a very large dataset, or both, to really benefit from parallelising the application.