Hey All,
I am trying to plot ratio of two normalized histograms. But problem is number of entries in the individual histograms is more compare to the ratio 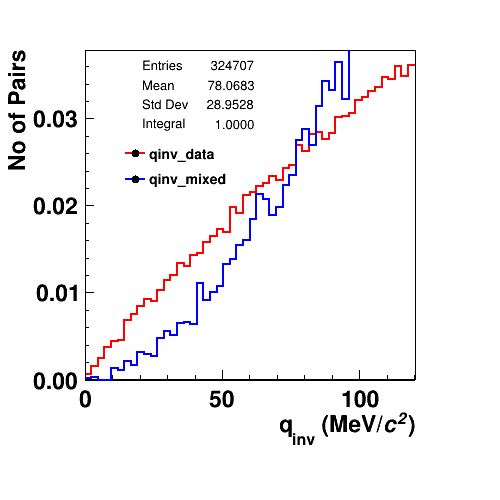
Please suggest how to resolve this problem,histogram_qinv.cpp (1.1 KB)
Thanks in advance .
Please read tips for efficient and successful posting and posting code
ROOT Version: Not Provided
Platform: Not Provided
Compiler: Not Provided
I don’t understand the problem. Could you reformulate it?
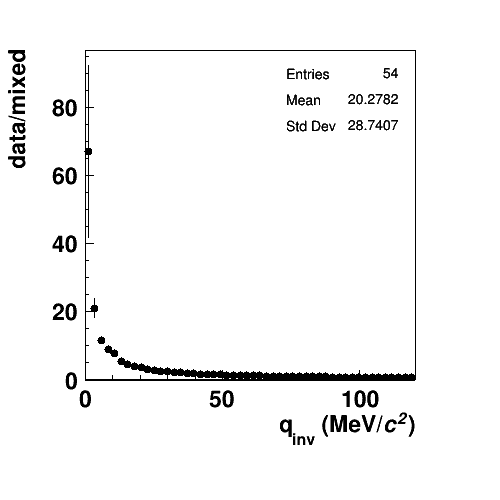
Is it correct that the bottom plot shows red/blue?
Thanks for your response. Yes I was trying plot red/blue. But if you look number of entries in individual histograms are 324707. But in the ratio plot entries are 54 and also distribution is not as expected.
I think it has 54 entries because the histogram has 54 bins (maybe check if that’s true).
Why is the distribution not as expected? It’s high where the histograms differ a lot, and it goes towards 1 / below 1 where the histograms cross. That look correct to me.
Just to check, I tried one more times. For both histograms having bin number 50 and ranging from 0 to 120.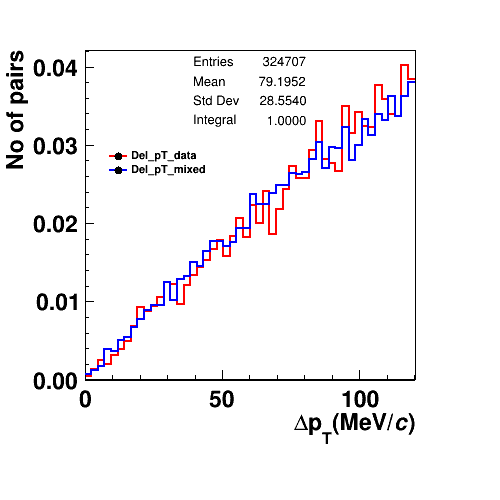
And ratio plot looks like:
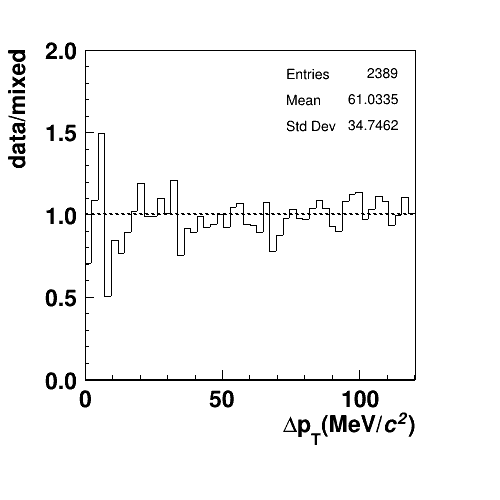
Now here number of entries in ratio plot 2389.
I used same macro which I attached.
Ok, the ratio plot looks perfect, only the number of entries is interesting.
I looked in the code as to what happens with the entries:
It computes the number of effective entries from the sum of weights in the histogram. The weights, in turn, depend on bin contents and bin errors.
Thank you so much for your remark. So are there any suggestion on the same?
No suggestions. What else do you need?
- The ratio is OK
- The entries try to give the best number of how much effective statistical uncertainty the histogram has.
I don’t see how you could do better.
If you really want, you can set the entries manually, but I cannot think of anything that’s better than what you already get.
Thank you so much. Yes now it is enough what I expected.