Hello,
I have some problem performing a ratio between two 2D histogram, hplot1 is represent channel1 vs time while hplot2 represent channel2 vs time. I would like to have channel2/channel1 versus time (doing this ratio each time bin), but the following code I think has some problem…
tupla->Draw(“var:time>>hplot1(100,0,100000,100,0,1000)”,“Channel==1”);
tupla->Draw(“var:time>>hplot2(100,0,100000,100,0,1000)”,“Channel==2”);
TH2F ratio = (*hplot1) / (*hplot2);
ratio->Draw();
thanks!
The operator ‘/’ is not defined as you ‘imagine’. You should use
h2d_1->Divide(h2d_2);
[quote=“stefano.tetto”]Hello,
I have some problem performing a ratio between two 2D histogram, hplot1 is represent channel1 vs time while hplot2 represent channel2 vs time. I would like to have channel2/channel1 versus time (doing this ratio each time bin), but the following code I think has some problem…
tupla->Draw(“var:time>>hplot1(100,0,100000,100,0,1000)”,“Channel==1”);
tupla->Draw(“var:time>>hplot2(100,0,100000,100,0,1000)”,“Channel==2”);
TH2F ratio = (*hplot1) / (*hplot2);
ratio->Draw();
thanks![/quote]
Hello,
it seems that with dived and “/” I get the same (wrong) result…
[quote=“zhiyiliu”]The operator ‘/’ is not defined as you ‘imagine’. You should use
h2d_1->Divide(h2d_2);
[quote=“stefano.tetto”]Hello,
I have some problem performing a ratio between two 2D histogram, hplot1 is represent channel1 vs time while hplot2 represent channel2 vs time. I would like to have channel2/channel1 versus time (doing this ratio each time bin), but the following code I think has some problem…
tupla->Draw(“var:time>>hplot1(100,0,100000,100,0,1000)”,“Channel==1”);
tupla->Draw(“var:time>>hplot2(100,0,100000,100,0,1000)”,“Channel==2”);
TH2F ratio = (*hplot1) / (*hplot2);
ratio->Draw();
thanks![/quote][/quote]
Please specify your exact problem or upload your code that can produce your problem.
[quote=“zhiyiliu”]The operator ‘/’ is not defined as you ‘imagine’. You should use
h2d_1->Divide(h2d_2);
[/quote]
Wrong, operator / is defined for histograms (and for 2d histograms). And it internally calls the “Divide” you recommended to use.
If ‘/’ is “wrong” for OP, ‘Divide’ is also “wrong” for him.
So, the code reproducing the problem is required.
Using both “/” or Divide I get the same result in fact. The code I have posted before, I have my tree which is called tupla and and draw two histo using this code:
tupla->Draw(“var:time>>hplot1(100,0,100000,100,0,1000)”,“Channel==1”);
tupla->Draw(“var:time>>hplot2(100,0,100000,100,0,1000)”,“Channel==2”);
hplot1 contains var when the branch Channel is 1, hplot2 the same for channel2, I would like to plot (over time) the ratio between them so the code I used is
TH2F ratio = (*hplot1) / (*hplot2);
ratio->Draw();
but the result of the Draw is something close to both histogram, it is not the ratio
[quote=“tpochep”][quote=“zhiyiliu”]The operator ‘/’ is not defined as you ‘imagine’. You should use
h2d_1->Divide(h2d_2);
[/quote]
Wrong, operator / is defined for histograms (and for 2d histograms). And it internally calls the “Divide” you recommended to use.
If ‘/’ is “wrong” for OP, ‘Divide’ is also “wrong” for him.
So, the code reproducing the problem is required.[/quote]
[quote=“stefano.tetto”]Using both “/” or Divide I get the same result in fact. The code I have posted before, I have my tree which is called tupla and and draw two histo using this code:
tupla->Draw(“var:time>>hplot1(100,0,100000,100,0,1000)”,“Channel==1”);
tupla->Draw(“var:time>>hplot2(100,0,100000,100,0,1000)”,“Channel==2”);
hplot1 contains var when the branch Channel is 1, hplot2 the same for channel2, I would like to plot (over time) the ratio between them so the code I used is
TH2F ratio = (*hplot1) / (*hplot2);
ratio->Draw();
but the result of the Draw is something close to both histogram, it is not the ratio
[/quote]
I’m afraid, if your TTree and histograms are classified data, it’s difficult to help you. Divide definitely works.
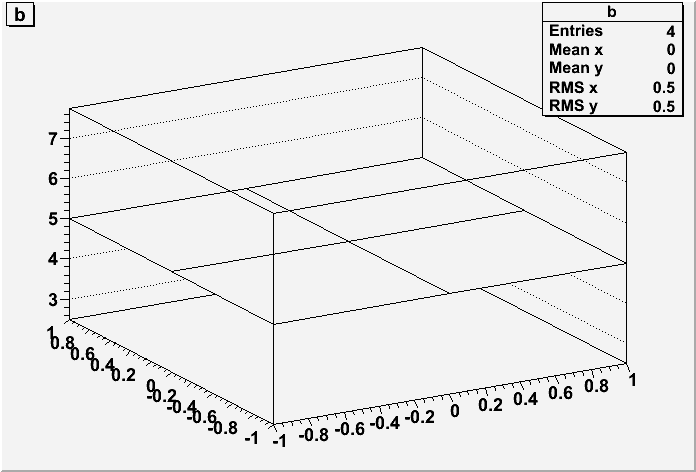
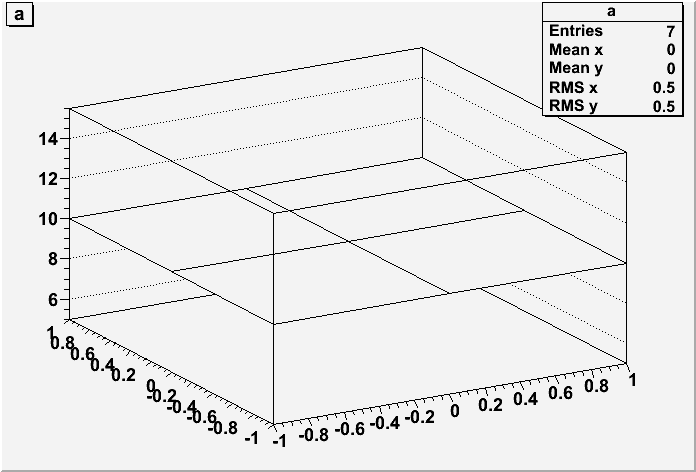
Look at my pictures - two histograms (h1 - all bins contain 10, h2 - all bins contain 5) and the result of their division.
So, if you tree is a top secret tree, you can, at least, show pictures for your histograms or even save them in a root file (and attach it). Your code is not really usefull.
No problem just the datafile was really big, I have posted both.
thanks
plot.C (3.77 KB)
timeline.txt (67.2 KB)
Well. First of all, your program crashes (I did not check why - boring  )
)
Second - local (“stack”) variable - result of division - dies at the end of block in which it’s declared.
And about division - your 2D histograms contains only zeros and ones (plot them and you’ll see), what do you expect from such division 1/1 or 0/0 or 0/1 or 1/0 - what should be the ratio?
ok i can check this 1s t then i tell u it works or not

 )
)