Hi all,
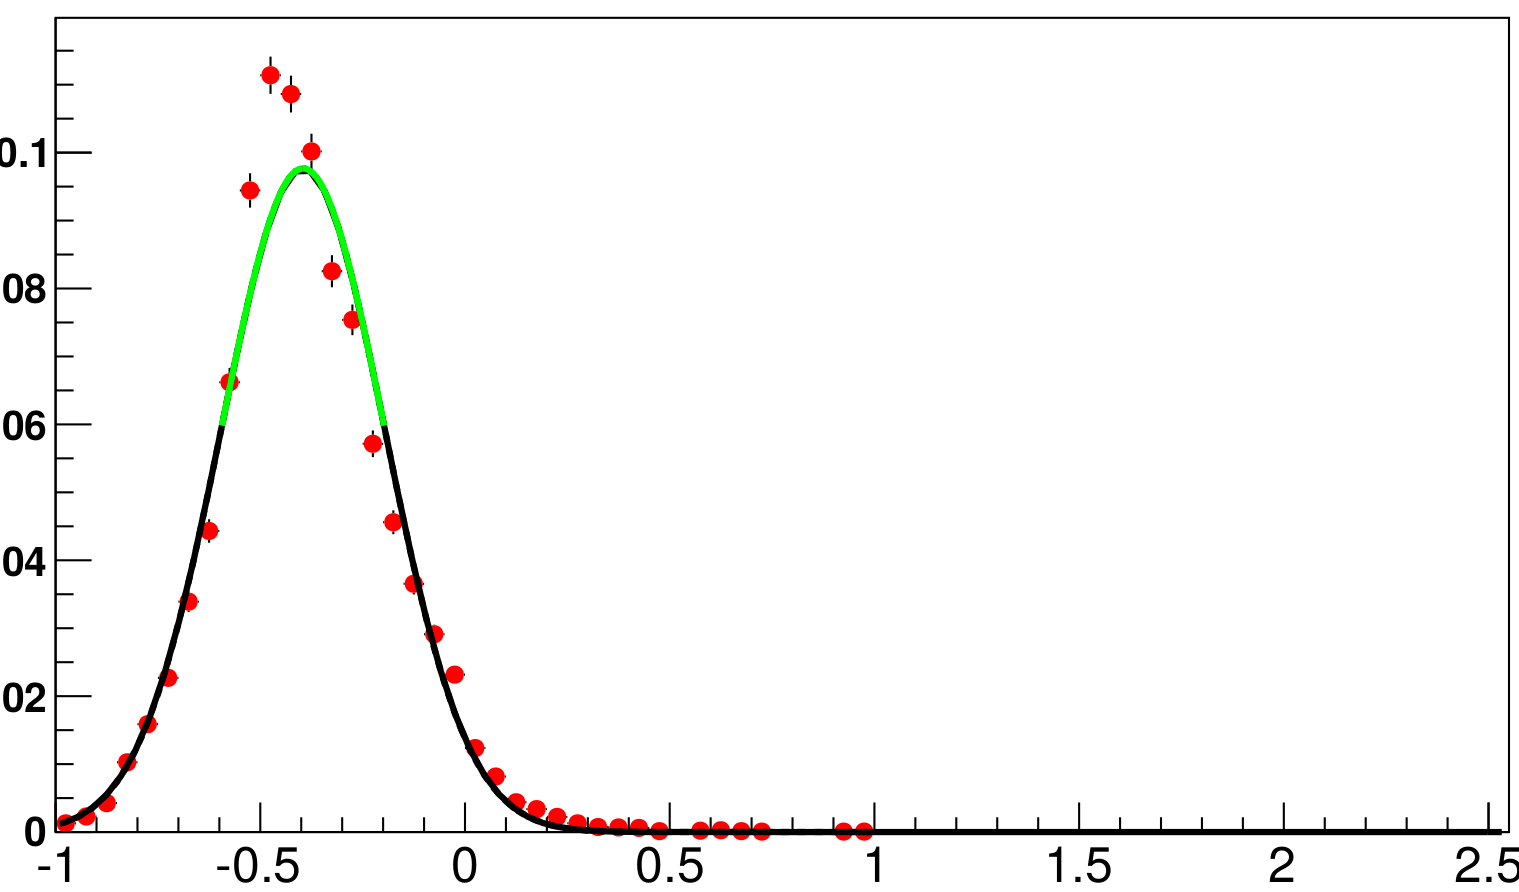
I am currently trying to iterate fits: fit a gaussian over an entire range, get mean and spread; fit a gaussian over the range [mu - sigma, mu + sigma]. I use the code below, but I believe that both fits are done to the entire range of the original distribution, and that the final plot is restricted to said ranges.
The returned values - p0, p1, p2 and chi² - are exactly the same for the two fits. Am I overlooking a technical detail here?
          TF1* f1 = new TF1("f1", "gaus",  fitlow, fithigh);
            f1->SetLineStyle(2);
            hJER_Slice->Fit("f1", "S");
            f1->Draw("same");

            double mean0 = f1->GetParameter(1);
            double spread0 = f1->GetParameter(2);

          TF1* f3 = new TF1("f3", "gaus", mean0-spread0, mean0+spread0);
            hJER_Slice->Fit("f3", "S");
            f3->SetLineColor(kGreen);
            f3->SetLineStyle(1);

            f3->Draw("same");
            f1->Draw("same");
Thanks, and kind regards
Alex
[color=#FF0000]UPDATE:[/color]
I realize what I did wrong: I defined my functions to be in two different ranges, but I did not specify the range in which they need to be fitted. My fits need to be:
          TF1* f1 = new TF1("f1", "gaus",  -10, 10);
            f1->SetLineStyle(2);
            hJER_Slice->Fit("f1", "S", "", fitlow, fithigh);
            f1->Draw("same");

            double mean0 = f1->GetParameter(1);
            double spread0 = f1->GetParameter(2);

            //
            // Second Gaussian
            //

          TF1* f3 = new TF1("f3", "gaus", -10, 10);
            hJER_Slice_2->Fit("f3", "S", "", mean0-spread0, mean0+spread0);
            f3->SetLineColor(kGreen);
            f3->SetLineStyle(1);
            f3->Draw("same");