Hi,
So I am currently trying to fit a large amount of TGraphs with a custom function that is the inbuilt “crystalball” TF1 multiplied by a user defined generalized sigmoid function. I’ve done this and taken the correlation matrix for each. Alongside this, I made 2D plots of the fit variables. What I found when comparing these two things confused me. I thought, perhaps naively, that if I see a high absolute value in the correlation matrix it would point to its respective variables looking correlated in the 2D distribution, and vice versa. However, this is not at all what I see. Instead there seems to be little relation that I can decipher between the correlation matrix and the distributions of these parameters.
I’m not sure it’s necessary for this question, but just for reference a simplified, non-runnable, version of my pyroot code would look like this:
import ROOT as r

#Getting tGraphs to be fit from file
tGraphFile = r.TFile("EXAMPLE_FILE.root")
listOfKeys = tGraphFile.GetListOfKeys()
#Getting fit functions to create the full fit function
crystalBallFunc = r.TF1("crystalBallFunc","crystalball",0.,230.)
sigMoidF = r.TF1("sigMoidF","1/(1+e**(-[0]*(x-[1])))**[2]",0.,230)
fitAr = []

#For setting initial parameters for the fit function
paramSet = [EXAMPLE_PARAMETER_SET]

#Creating a full fit function for every tGraph to be fit
#I've had weird issues using the same fit function multiple times, so this is to sidestep that.
for i in range(len(listOfKeys)):
    fitAr.append(r.TF1("crystalSigmoidF{0}".format(i),"crystalBallFunc*sigMoidF",0.,230.))
    fitAr[-1].SetNpx(1000)
    fitAr[-1].SetParameters(*paramSet)

#Setting up arrays to loop over when creating histograms
fitVarMinMaxAr = [[EXAMPLE_SET_OF_HISTOGRAM_BOUNDS_0],...[EXAMPLE_SET_OF_HISTOGRAM_BOUNDS_7]]
fitVarNameAr = ["p5","p6","p7","Alpha","Constant","Mean","N","Sigma"]

#Creation of the main histograms comparing the different fit variables to each other
comparingParametersHist2DAr = [[r.TH2F("{0} vs {1}".format(fitVarOneName,fitVarTwoName),"{0} vs {1}".format(fitVarOneName,fitVarTwoName),50,fitVarTwoMinMaxSet[0],fitVarTwoMinMaxSet[1],50,fitVarOneMinMaxSet[0],fitVarOneMinMaxSet[1]) for fitVarTwoMinMaxSet,fitVarTwoName in zip(fitVarSummarizedAr[i+1:],fitVarNameAr[i+1:])] for fitVarOneMinMaxSet,fitVarOneName,i in zip(fitVarMinMaxAr,fitVarNameAr,range(8))]
comparingParametersCan2DAr = [[r.TCanvas() for fitH in fitHistSet] for fitHistSet in comparingParametersHist2DAr]

#To Hold the tGraphs as they're read in
objAr = []

#Main fitting loop
for i,keyVal in enumerate(listOfKeys):
    #Read the key value, put in objAr array
    tmpObj = keyVal.ReadObj()
    objAr.append(tmpObj)

    #Fit the tGraph
    tmpFitRes = objAr[-1].Fit("crystalSigmoidF{0}".format(i),"SM")
    #Checking the fit is valid
    if tmpFitRes.IsValid():
        #Getting the correlation matrix from the fit
        tmpCorMat = tmpFitRes.GetCorrelationMatrix()
        #Looping over the 8 by 8 matrix
        for j in range(8):
            #For the histograms, getting the fit result of the first parameter
            paramTmp = crystalSigmoidFAr[i].GetParameter(j)
            for k in range(8):
                #For the averages, adding the elements of the correlation matrix
                corAvg=Ar[j][k] += tmpCorMat[j][k]
                if j == k:
                    if tmpCorMat[j][k] != 1.0:
                        #Debug
                        print("Uhoh, the diagonal of this correlation matrix is not equal to 1.0")
                        print("j =",j,"k =",k,"tmpCorMat[j][k] =",tmpCorMat[j][k])
                #Didn't want duplicate histograms, so variable j is only compared to variable k if k > j
                #Prevents one histogram being for "j compared to k" and a later histogram being for "k compared to j"
                elif k > j:
                    comparingParametersHist2DAr[j][k-j-1].Fill(crystalSigmoidFAr[i].GetParameter(k),paramTmp)

        forAverageCounter += 1

#Printing out the summed of the correlation matrices before and after dividing by the counter to get the average
print("Correlation matrix")
print("Before dividing:")
for j in range(8):
    for k in range(8):
        corAvgAr[j][k] = corAvgAr[j][k]
        print(format(corAvgAr[j][k],".3f"),end=", ")
    print("")
print("------------------------------------------------------------------------------")

print("After dividing:")
for j in range(8):
    for k in range(8):
        corAvgAr[j][k] = corAvgAr[j][k] / forAverageCounter
        print(format(corAvgAr[j][k],".3f"),end=", ")
    print("")
print("------------------------------------------------------------------------------")


#Drawing and saving the comparison histograms
r.gStyle.SetOptStat(0)
for j,fitVarOneName in enumerate(fitVarNameAr):
    for k,fitVarTwoName in enumerate(fitVarNameAr[j+1:]):
        comparingParametersCan2DAr[j][k].cd()
        comparingParametersHist2DAr[j][k].Draw("COLZ")
        comparingParametersCan2DAr[j][k].SaveAs("{0}vs{1}.png".format(fitVarOneName,fitVarTwoName))
To give an example, here is the correlation matrix I received after running my code:
After dividing:
1.000, 0.332, 0.155, 0.067, -0.853, 0.698, 0.012, -0.515,
0.332, 1.000, -0.844, 0.013, -0.184, 0.117, 0.000, -0.060,
0.155, -0.844, 1.000, -0.002, -0.113, 0.065, -0.002, -0.021,
0.067, 0.013, -0.002, 1.000, -0.094, 0.109, 0.904, -0.118,
-0.853, -0.184, -0.113, -0.094, 1.000, -0.937, -0.025, 0.784,
0.698, 0.117, 0.065, 0.109, -0.937, 1.000, 0.036, -0.935,
0.012, 0.000, -0.002, 0.904, -0.025, 0.036, 1.000, -0.048,
-0.515, -0.060, -0.021, -0.118, 0.784, -0.935, -0.048, 1.000,
Note that the order of the correlation matrix is, I’m assuming, the same as the order I get when I look at the GetParName function of the fit, which gives:
for i in range(8):
    print(tmpFit.GetParName(i))
p5
p6
p7
Alpha
Constant
Mean
N
Sigma
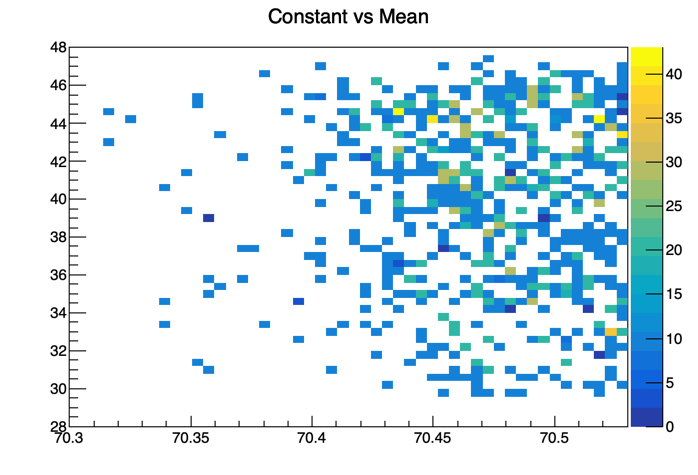
So, compare this to the actual graphs, e.g., Constant (parameter four) vs Mean (parameter five). The correlation matrix has these variables highly negatively correlated at -0.937, but the graph I receive is an unimpressive, seemingly random scattering of values:
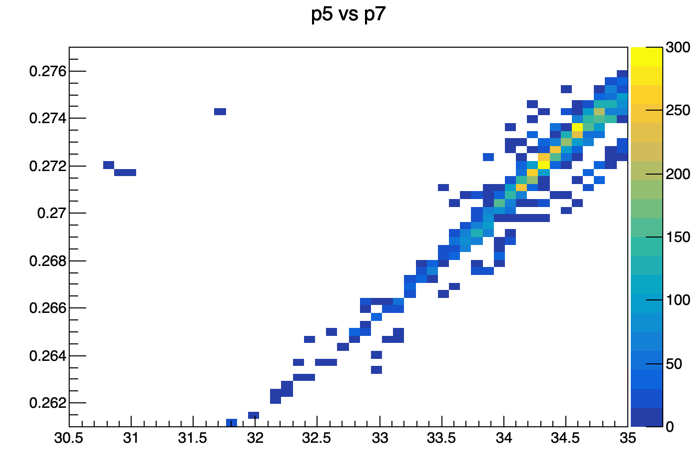
Or the graph for p5 (parameter zero) vs p7 (parameter two), which seems to be very highly positively correlated, but has a value of 0.155 in the correlation matrix:
Anyway, I’m sure I must be misunderstanding something about what I should be expecting to see here, so please let me know if you see where I am going wrong.
Finally, for reference I am using pyroot with python3.6 and Root Version 6.19/01. My OS Is MacOS Catalina, Version 10.15.3