Hi!
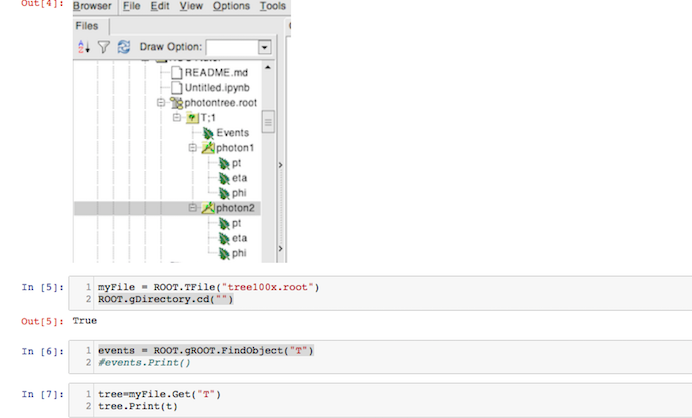
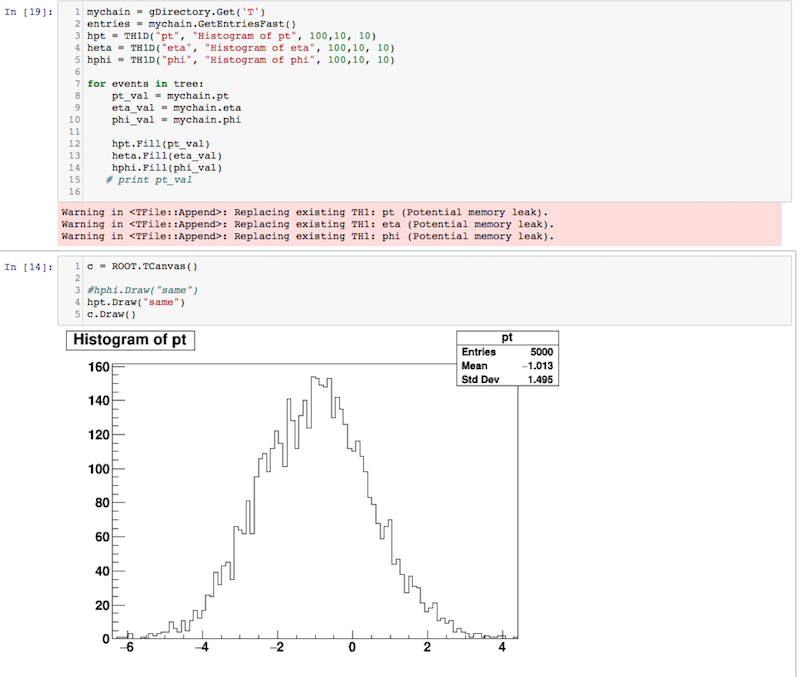
I’m trying to plot different histograms of Photon1 and Photon2 (e.g. pt, eta, phi) but I can’t seem to access them separately when I do mychain.GetEntriesFast(). Does anyone know if this can be done in pyroot?
tree100x.root (121.5 KB)
Hi!
I’m trying to plot different histograms of Photon1 and Photon2 (e.g. pt, eta, phi) but I can’t seem to access them separately when I do mychain.GetEntriesFast(). Does anyone know if this can be done in pyroot?
tree100x.root (121.5 KB)
Hi,
I do not understand what are you trying to do. The snippets are not coherent! I assume you want two histograms, eta of photon 1 and photon2. Then the code would look like:
myfile = ROOT.TFile("tree100x.root")
events = myfile.T

heta1 = ROOT.TH1D("eta1","eta1",128,-5,5)
heta2 = ROOT.TH1D("eta2","eta2",128,-5,5)

for e in events:
    heta1.Fill(e.photon1.eta)
    heta2.Fill(e.photon1.eta)

heta1.Draw()
heta2.Draw("same")
cheers,
D
Hi D,
Thank you for your reply. That is what exactly what I’m trying to do.
Now, when I tried it I get an error:
AttributeErrorTraceback (most recent call last)
<ipython-input-6-cb48b3975ec2> in <module>()
      3
      4 for e in events:
----> 5     heta1.Fill(e.photon1.eta)
      6     heta2.Fill(e.photon2.eta)
      7

AttributeError: 'TTree' object has no attribute 'photon1'
Seems like a simple problem but I hope experts could help furthermore.
cheers,
UP
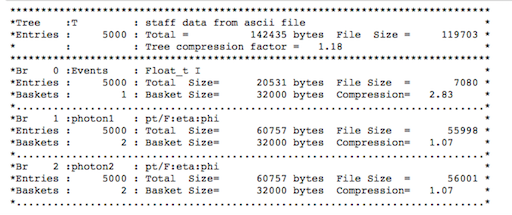
Could you add the output of the tree.Print() command?
Hi Graipher,
Here it is.