Projections of a TH3 Not Working

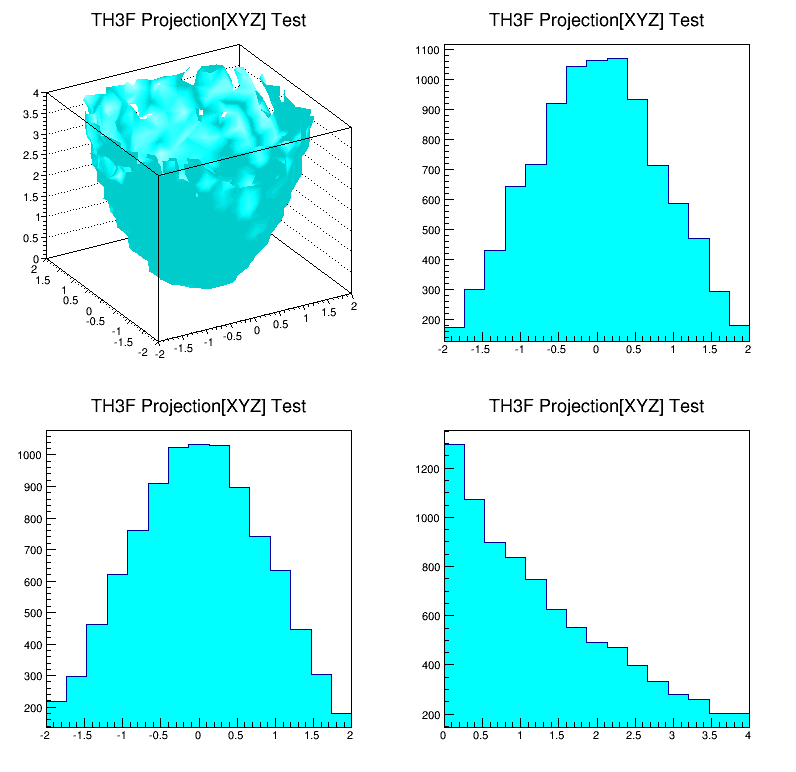
I currently have a TH3 plot and I’m working on getting the X and Y projections of the TH3. The TH3 plots well, but the X and Y projections plot as a flat line. I attached related code. My program reads from a file that has three columns, each row presents a set of coordinates.

TCanvas *canvas1 = new TCanvas("canvas1", "canvas", 900, 900);
TH3F *plot = new TH3F("test", "test", 100, 0, 100, 100, 0, 100, 100, 0, 100);
 
      while (! feof (filename))
        {
          fscanf (filename, "%f %f %f \n", &x, &y, &z);
          plot -> Fill(x, y, z);
        }

canvas1 -> Divide (2,2);
canvas1 -> cd(1);
plot -> Draw("ISO");

canvas1 -> cd(2);
plot -> ProjectionX() -> Draw();

canvas1 -> cd(3);
plot -> ProjectionY() -> Draw();

Try: [code]{
TH3F *plot = new TH3F(“plot”, “TH3F Projection[XYZ] Test”,
15, -2, 2, 15, -2, 2, 15, 0, 4);
plot->SetFillColor(kCyan);

Double_t x, y, z;
for (Int_t i = 0; i < 10000; i++) {
gRandom->Rannor(x, y);
z = x * x + y * y;
plot->Fill(x, y, z);
}

gStyle->SetOptStat(kFALSE);

TCanvas *canvas1 = new TCanvas(“canvas1”, “canvas1”, 800, 800);
canvas1->Divide(2, 2);

canvas1->cd(1);
plot->Draw(“ISO”);

canvas1->cd(2);
plot->ProjectionX()->Draw();

canvas1->cd(3);
plot->ProjectionY()->Draw();

canvas1->cd(4);
plot->ProjectionZ()->Draw();

canvas1->cd(0);
}[/code]

I ran your code. I am getting a straight line still.

Can you also explain to me the difference between your code and mine (in terms of creating the projections)? I am very new to ROOT.

I think you need to report your ROOT version, operating system version, compiler version, …

The difference between “your code” and “my code” is that I gave you a FULL WORKING EXAMPLE.


I’m using ROOT 5.32, Ubuntu 6, and interpreter version 5.18.

And sorry, I did not realize I was supposed to post all the code. I only pasted the parts I thought were relevant.

The picture in my previous post here comes from ROOT 5.34, but I get a similar picture from ROOT 5.28 (Ubuntu 10.04 LTS / i686, gcc 4.4.3).
(Note: the CINT interpreter version is always “5.18.00, July 2, 2010”.)

So, try another version of ROOT (maybe there’s a bug in your version).

I think I’ve noticed what is going on.

I would like my Projections to show the X vs Z and the Y vs Z plots (which I thought was the default of ProjectionX() and ProjectionY() ). It appears to be showing the X vs Y and then the Y vs X. Is there some way I can change this?

TH3::Project3D
TH3::Project3DProfile

Thank you! I did not realize I was trying to use the wrong methods. I could only find ProjectionX() and ProjecttionY() in the documentation.

Try: [code]{
TH3F *plot = new TH3F(“plot”, “”,
15, -2, 2, 15, -2, 2, 15, 0, 4);
plot->SetFillColor(kCyan);

Double_t x, y, z;
for (Int_t i = 0; i < 10000; i++) {
gRandom->Rannor(x, y);
z = x * x + y * y;
plot->Fill(x, y, z);
}

gStyle->SetOptStat(kFALSE);

TCanvas *canvas1 = new TCanvas(“canvas1”, “canvas1”, 800, 600);
canvas1->Divide(4, 3);

canvas1->cd(1);
plot->Draw(“ISO”);

canvas1->cd(2);
plot->Project3D(“x”)->Draw();

canvas1->cd(3);
plot->Project3D(“y”)->Draw();

canvas1->cd(4);
plot->Project3D(“z”)->Draw();

canvas1->cd(6);
plot->Project3D(“xy”)->Draw();

canvas1->cd(7);
plot->Project3D(“xz”)->Draw();

canvas1->cd(8);
plot->Project3D(“yz”)->Draw();

canvas1->cd(10);
plot->Project3DProfile(“xy”)->Draw();

canvas1->cd(11);
plot->Project3DProfile(“xz”)->Draw();

canvas1->cd(12);
plot->Project3DProfile(“yz”)->Draw();

canvas1->cd(0);
}[/code]