Dear experts,
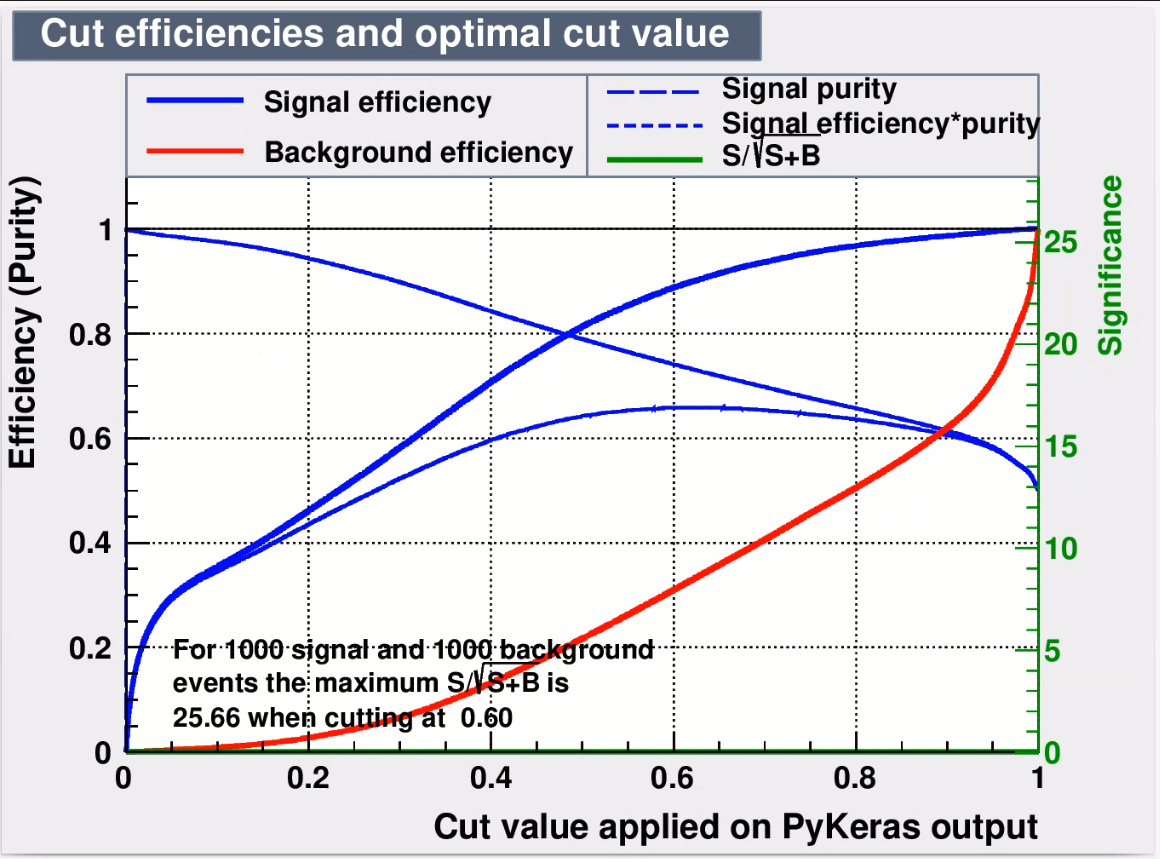
I am currently experiencing some issues using the PyKeras model. In particular, at the end of training, I can’t visualise the curve that shows the significance values in function of the cut value.
No matter how I train the model, the curve is not displayed, despite I have a discrete value of max significance at a specific cut (after some math that appears to be more or less correct).
How can I solve this?
Thank you,
Tommaso