im having problems with the scaling of my graphs. The gPad->SetLogy()
command switches the axis labeling but does not alter the shape of the
functions (exp stays exp, where it should be linear) that i have on my pad - am I missing something?
An example code to reproduce the problem would look like this:
{
gROOT->Reset();
gROOT->SetStyle(“Modern”);
TCanvas *canv = new TCanvas( “gl_gLifeTime” , “Life Time”, 1024, 768 );
TF1 *f1 = new TF1( “f1” , “[0] + [1]exp(-1x/[2])” , 0, 200 );
Double_t fitpar[3];
fitpar[0] = 73.0f;
fitpar[1] = 130.0f;
fitpar[2] = 20;
f1->SetParameters(fitpar);
canv->cd();
gPad->SetGrid();
gPad->SetLogy();
f1->Draw(“L”);
}
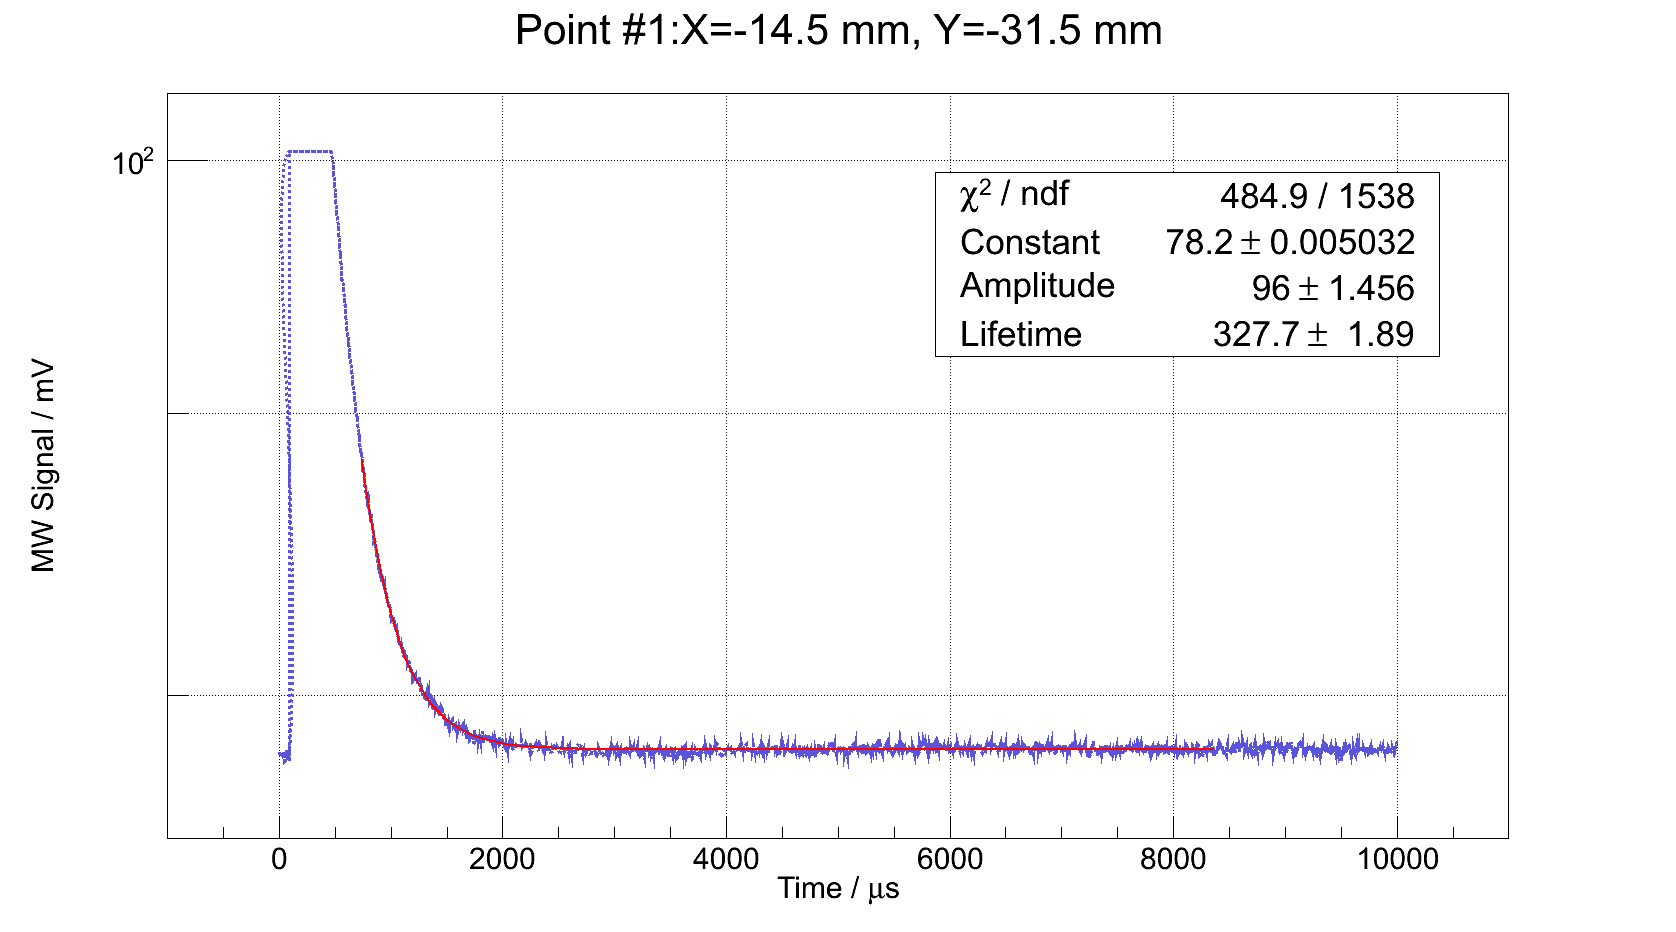
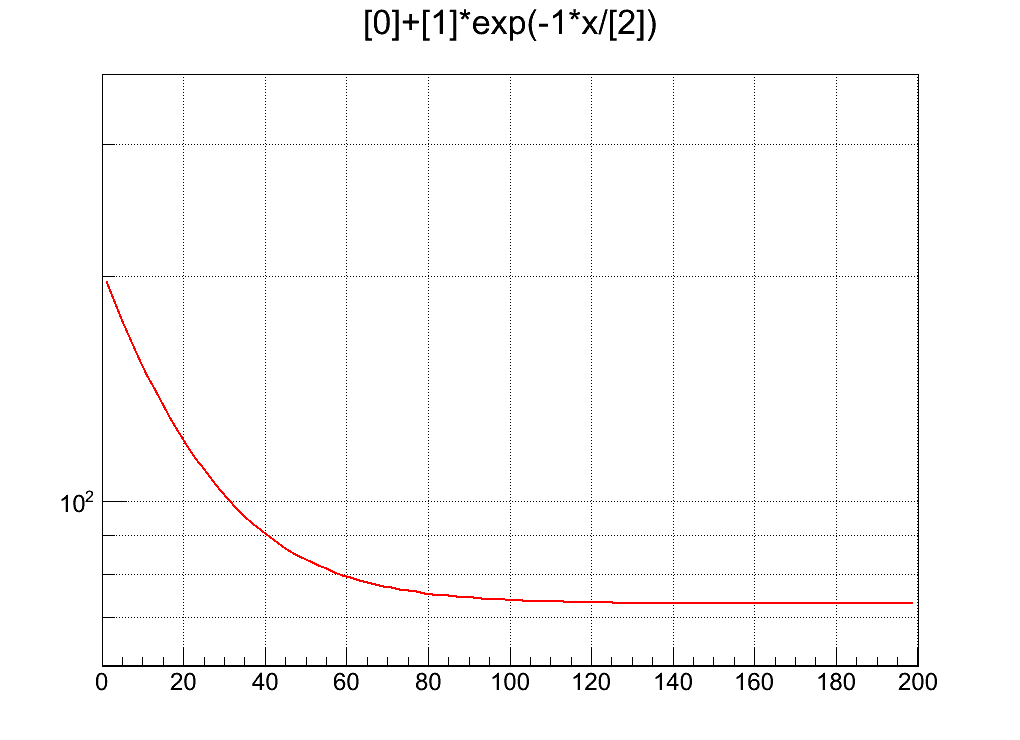
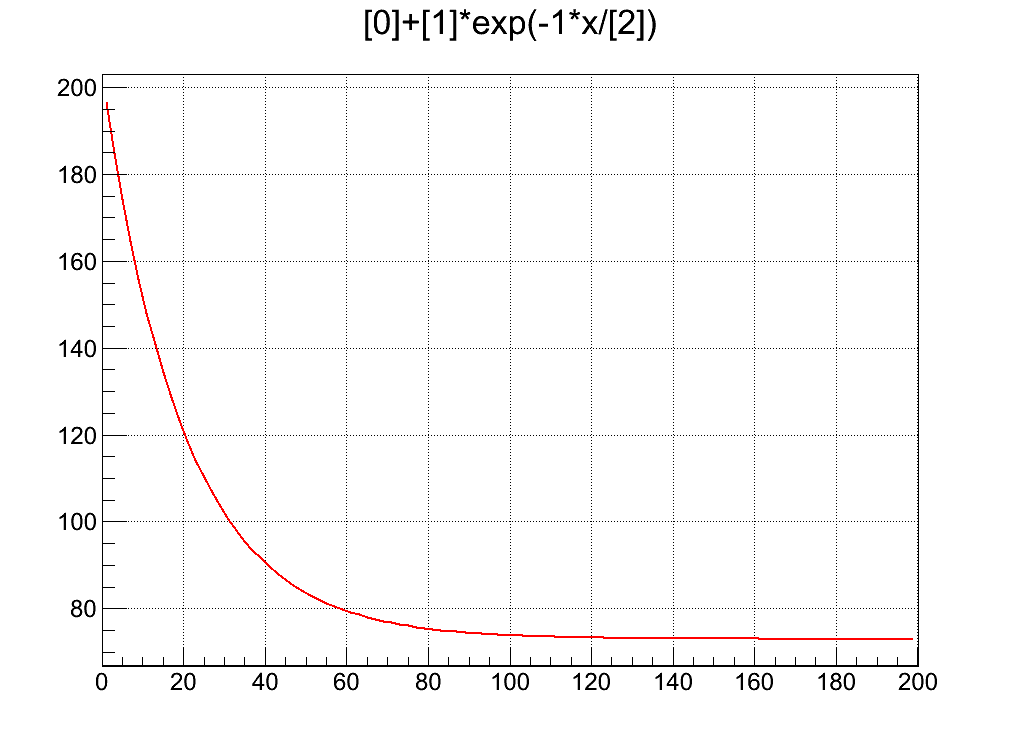
Additionally im attaching two pictures, one in lin-scale the other one
in log-scale to demonstrate the output i get on my machine (arch-linux,
root installed via Arch User Repository).
You are right, that solves the representation problem - but my function has a constant part, so I would like to have a way without changing my original function (in the sample code its of course just a simple function - in my real data its a messy fitfunction with a TGraphErrors-Object). I do not understand why ROOT should have a problem with an offset in my functions…
So, in order to get the desired result with the following graph the only way is to subtract the offset from all the points?? Or is there a more elaborate approach to it when handling TGraphs?
If you subtract an “offset”, you will possibly get some points which have non-positive “y” values -> then you will not be able to draw them in log-y mode.
Try to draw … “ExperimentalData / FittedFunction” … which should be a nice “flat” graph/histogram around 1, or maybe … “ExperimentalData - FittedFunction” … which should also be a nice “flat” graph/histogram around 0. No need to use log-y mode in these cases.
 Tank you.