I am new with ROOT and I have some problems related with fitting histograms. First of all, I am trying to analysis the Z decays into pairs of muons, as well, I generate all the data and plotted it in a histogram.
The histogram has only one signal + background. Then I did the steps below:
Fitted only the background
Created a random histogram with the fitted background function
Subtract the random background histogram from the total histogram
As expected the result was only the signal with a couple of points
in some sense I think this post is not related to ROOT or the fitting tools it provides.
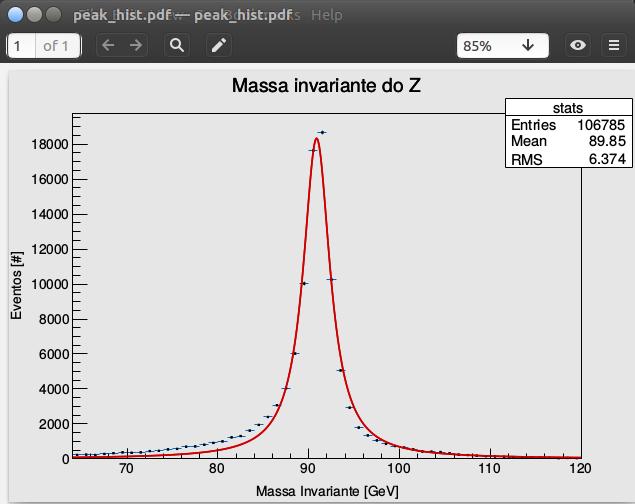
The “goodness” of your result is probably due to the fact that your background subtraction procedure needs some attention and perhaps to the fact that the function you fit is not perhaps accurately describing the shape of the Z peak.
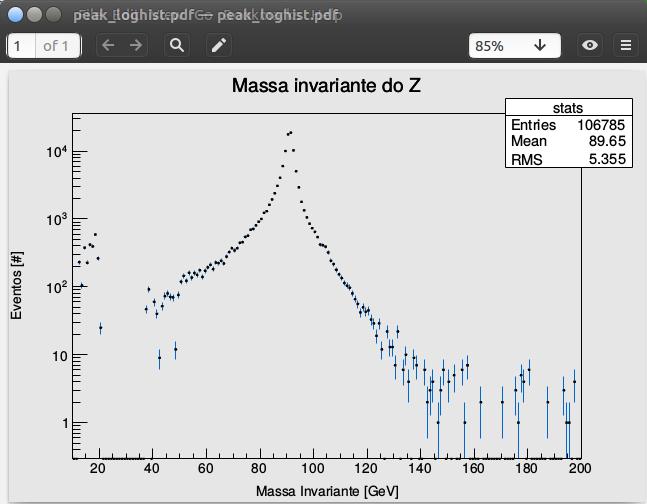
It looks like your fit function does not take into account the asymmetry of the peak, as in your code there is only a simple Lorentzian as the fit function. Looking at the graph, on the left the number of events is ~100, while on the right it is only ~1-2. Not sure how you fitted the background, but subtracting a randomly generated histogram does not sound right to me. To improve your results, it may be possible to just add a linear term to your fit function, but it might make more sense to look for the kinematic dependence (i.e., when the Z boson is not at rest) to correct your fit function appropriately if that’s what gives you this asymmetry. You may want to take a look at pages 27-33 of this document for more information. I hope that helps.
Here (section 9.1, page 54) is another source of information, where a combination of a convolution of a Lorentzian with a Gaussian (to account for detector resolution) and an exponential (for the background) is used. This is probably what you need to do in your analysis.