Hi everyone,
I am beginner of Garfieldpp.I tried to imitate Silicon in the example to output a gif of the drift lines and signals. I used the ComponentTcad2d and TrackHeed classes in the simulation, but the output remains the same instead of being updated.
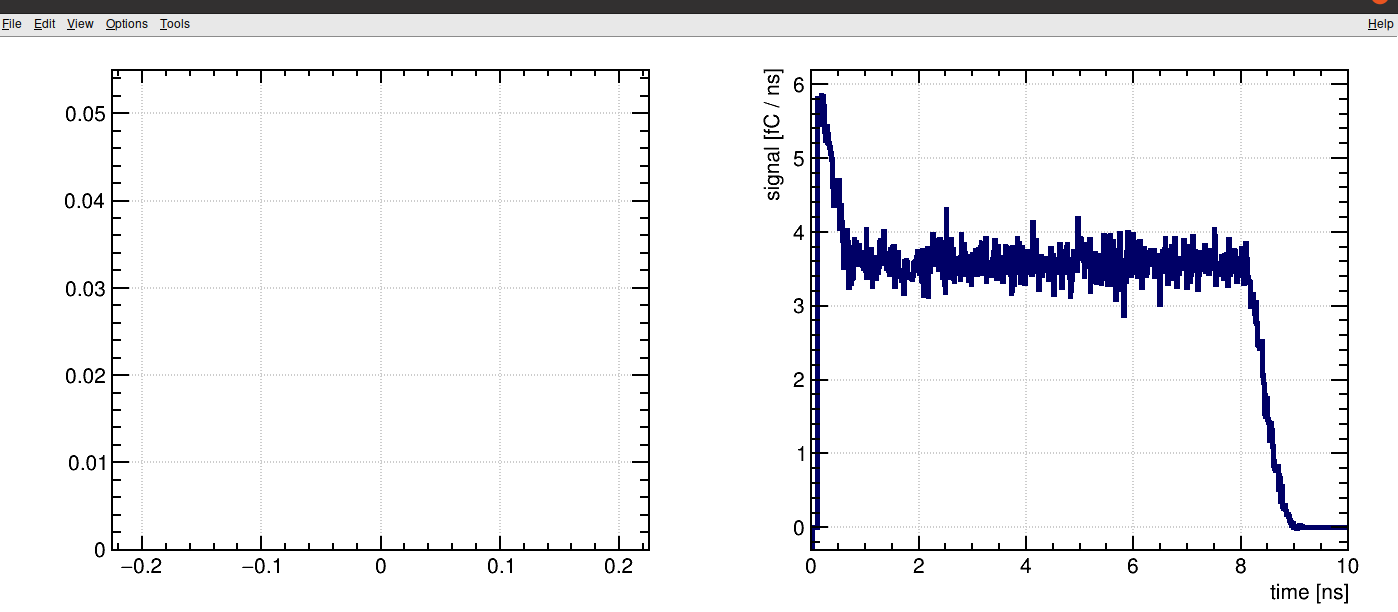
I attach the Plot code and the result.
double t = 0.;
double dt = 0.1;
const unsigned int nFrames = 100;
for (unsigned int i = 0; i < 100; ++i) {
  vDrift.Clear();
  drift.SetTimeWindow(t, t + dt);
  vDrift.Plot2d(true, true);
  vSignal.PlotSignal("anode");
  gSystem->ProcessEvents();
  constexpr bool gif = true;
  if (!gif) {
      char filename[50];
      sprintf(filename, "frames/frame_%03d.png", i);
      canvas.SaveAs(filename);
  } else {
  if (i == nFrames - 1) {
      canvas.Print("movie.gif++");
  } else {
      canvas.Print("movie.gif+3");
  }`Preformatted text`
  }
std::cout << "Drift time window: [" << t << ", " << t + dt << "] ns\n";
t += dt;
}
    std::cout << "End of GIF" << "\n";
So the drift line calculation and signal are already once this loop is finished.
If you want to create an animation, you need to call AddElectron, AddHole instead of DriftElectron, DriftHole and then use SetTimeWindow, ResumeAvalanche in a subsequent loop to simulate the drift, as done in this example:
There is however a catch; if you do that, you cannot do the scaling of the signal (SetElectronSignalScalingFactor, SetHoleSignalScalingFactor) the way it’s done in your program. I’ll need to implement an additional functionality to set a weighting factor for each electron/hole.