Problems about ViewField

I use ComponentConstant to create a uniform electric field along the z direction and us ViewField for visualization to ensure that I have established the uniform electric field.But the view result is blank.How can I visualize the uniform electric field?
This is my code.

int main(int argc, char *argv[])
{
    TApplication app("app", &argc, argv);
    // Set gas
    MediumMagboltz gas;
    gas.SetTemperature(293.15);
    gas.SetPressure(760.);
    gas.SetComposition("Ar", 0.94, "CO2", 0.03, "H2O", 0.03, "O2", 20.9, "N2", 78.1);
    gas.Initialise(true); // prepares the table of microscopic scattering rates
    gas.LoadGasFile("gas_293_1atm_10-100000nE20.gas");
    const string ionpath = std::getenv("GARFIELD_INSTALL");
    gas.LoadIonMobility(ionpath + "/share/Garfield/Data/IonMobility_Ar+_Ar.txt");

    ComponentConstant cmp;
    constexpr double xlength = 10.; // cm
    constexpr double ylength = 10.;
    constexpr double zlength = 10.;
    cmp.SetArea(0., 0., 0., xlength, ylength, zlength);
    cmp.SetMedium(&gas);
    cmp.SetElectricField(0., 0., 1000.);

    ViewField fieldView;
    constexpr bool plotField = true;
    if (plotField)
    {
        fieldView.SetComponent(&cmp);
        fieldView.SetPlane(0, -1, 0, 0, 0, 0); //viewing plane (xz plane).
        fieldView.SetArea(0., 0, 0, xlength, ylength, zlength); //plot limits
        TCanvas *cf = new TCanvas("cf", "", 600, 600);
        cf->SetLeftMargin(0.16);
        fieldView.SetCanvas(cf);
        fieldView.PlotContour("e");
    }
    app.Run(true);
}

This is the result.


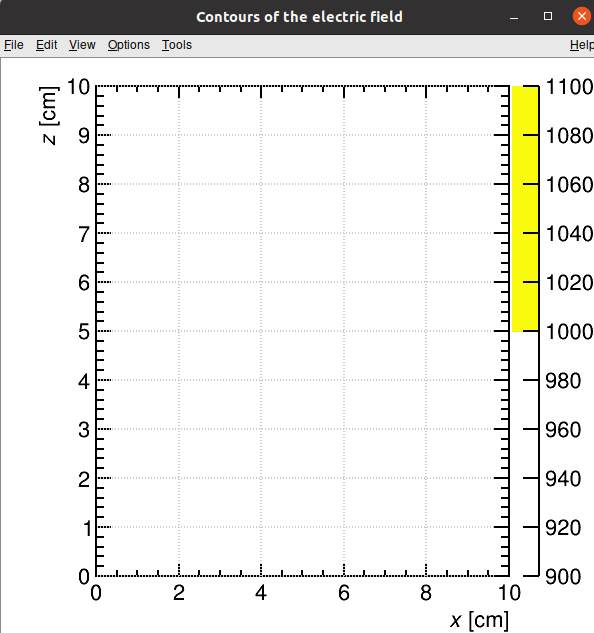
Looking forward to your reply, thank you very much!

The plot looks correct to me, it shows a constant value of 1000 V/cm. For a uniform field, a contour plot of the field is not very instructive…

  1. Emm, you mean the result is right? But I see nothing
  2. How to show the uniform electric field is instructive ?
  3. in Examples I see fieldView.PlotFieldLines ( )
std::vector<double> xf;
std::vector<double> yf;
std::vector<double> zf;
fieldView.EqualFluxIntervals(xmin, 0, 0.99 * zmax, xmax, 0, 0.99 * zmax, xf, yf, zf, 20);
fieldView.PlotFieldLines(xf, yf, zf, true, false);

if I want to PlotFieldLines to show the uniform field, how should I modify the parameters of EqualFluxIntervals()? I don 't quite understand how to use EqualFluxIntervals.

What do you mean? The plot shows a constant value. What did you expect to see from a contour plot of a uniform field?

If you want to see a gradient, you could plot the contours of the potential instead of the electric field.

EqualFluxIntervals is a helper function for choosing the starting points for a field line plot. You specify the starting point, end point, and the number of points, and the function will return you the coordinates of a set of points with a spacing corresponding to the density of electric field lines. You can then pass the coordinates of these points to the function PlotFieldLines to be used as starting points.

Oh,I got it ! I mistakenly thought I was drawing the potential.Thank you for your patient explanation

This topic was automatically closed 14 days after the last reply. New replies are no longer allowed.